Diagrams From Biology
Diagrams · A Visual Essay
Diagrams From Biology
The pictures that made the field click — and what they add up to.
I've been teaching myself biology, and these are the diagrams I kept screenshotting — the moments something suddenly made sense. Collected together they make an argument I didn't expect: that biology is, underneath, an information science. Life encodes a body in a one-dimensional string, computes the shape out of it, scales that one trick across twenty-four orders of magnitude — and we are only now learning to read and write the code ourselves.
Start with the oldest question in developmental biology: how does a straight line become a tree? The genome is one-dimensional, yet it folds out into a three-dimensional body the same way every time. Nobody hands the cell a blueprint. The shape has to be computed.
How do we make trees?
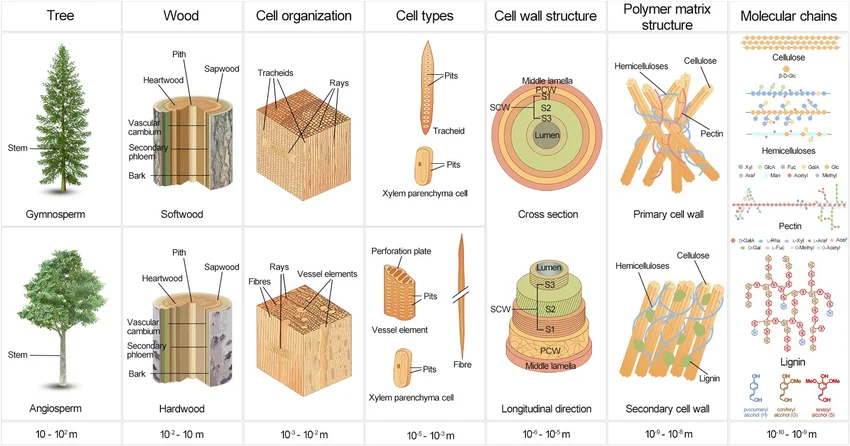
This one figure rearranged how I think about form. Read it left to right and you fall from a whole tree down through wood, cell organisation, the cell wall, and finally the polymer chains of cellulose and lignin — six orders of magnitude in a single row. The structure is self-similar: the same fibres-in-a-matrix logic repeats at every scale. A tree isn't drawn top-down. It's one small rule, run over and over.
It helped to stop thinking of a cell as a machine following a plan, and start thinking of it as a self-assembling factory — one that builds the plan as it goes.
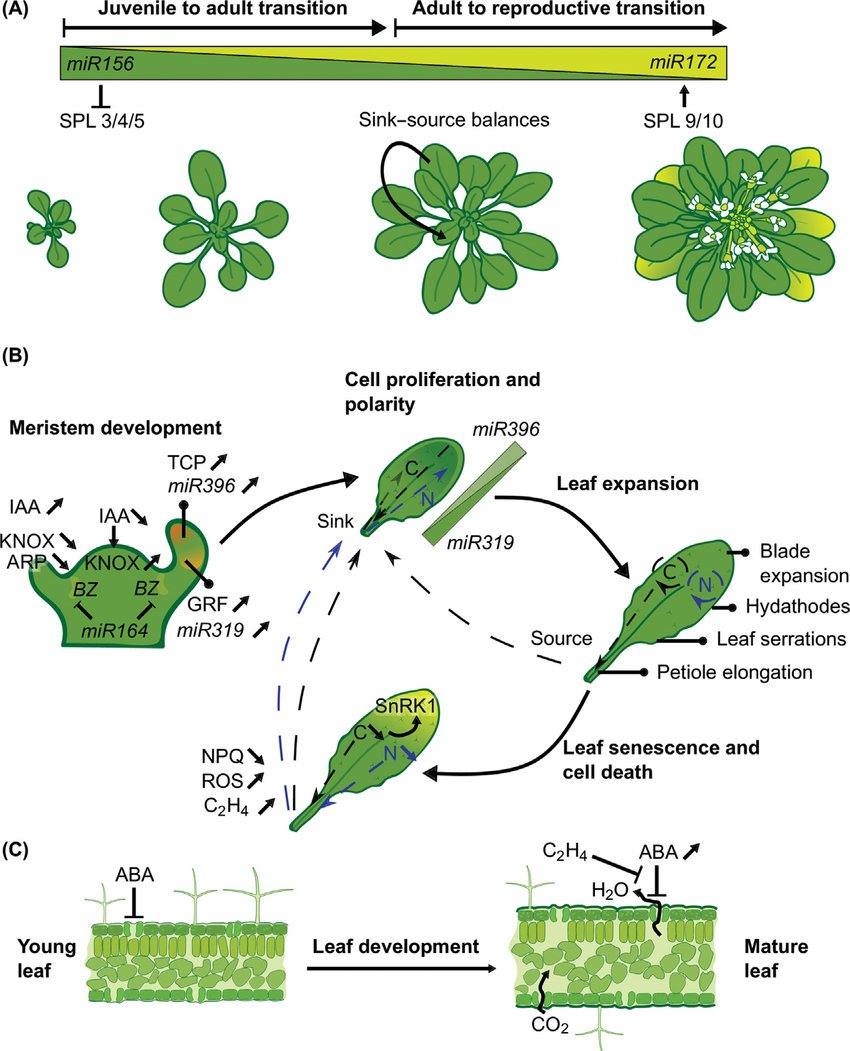
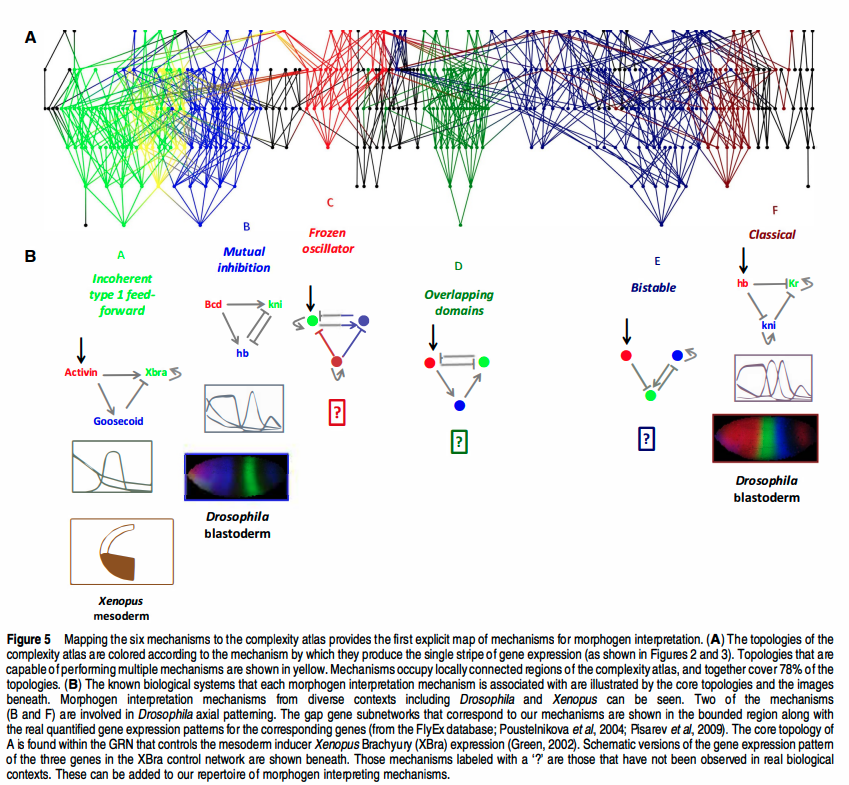
Because development is a dynamical system. A leaf doesn't unfold from a stored image; it relaxes into shape as hormones and genes push on each other. A single hand-off — miR156 giving way to miR172 — is enough to walk a plant from juvenile to adult to flowering. So much of modern plant biology is reverse-engineering those circuits: finding the feedback loops and oscillators (a literal clock-and-wavefront, the same trick that segments your spine) that decide what a cell becomes — then charting the whole repertoire as a state space, every stable form the network can fall into.
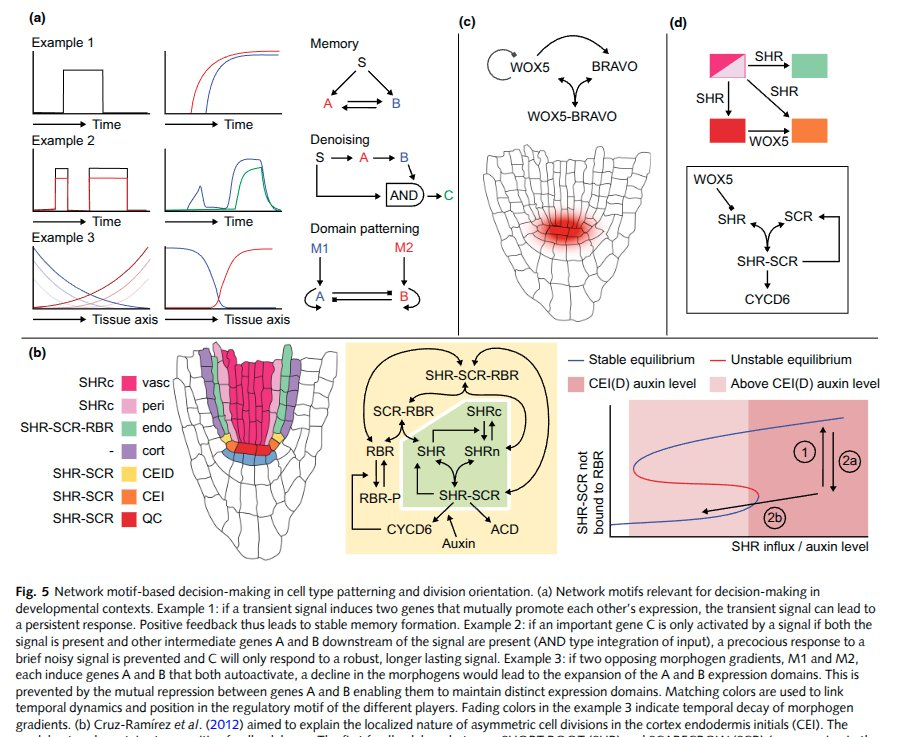
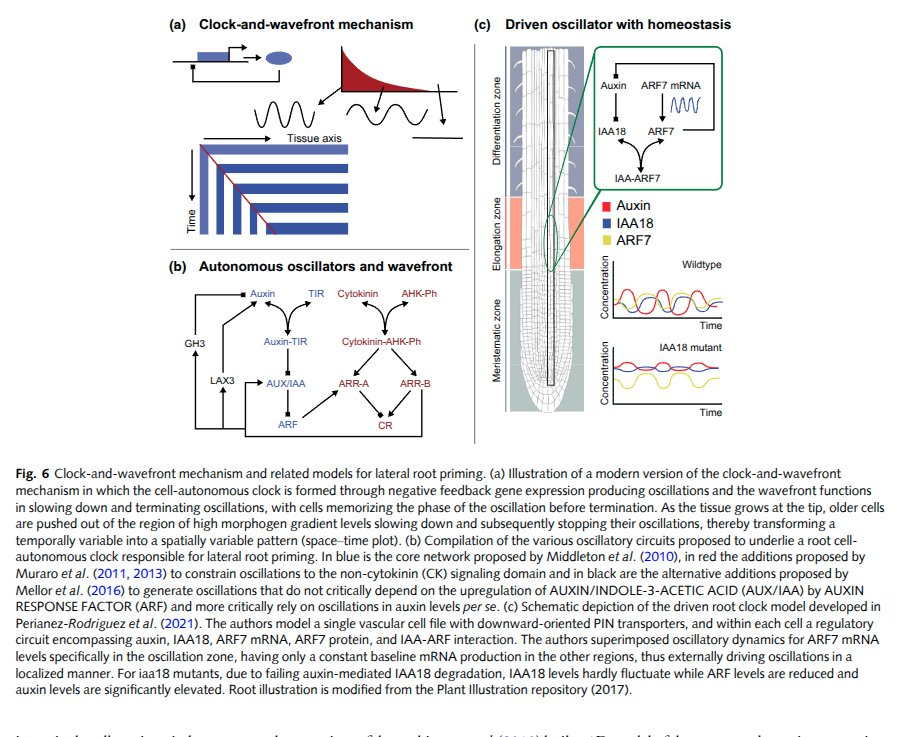
From: Computational modeling of plant root development: the art and the science
Studying how plants grow.
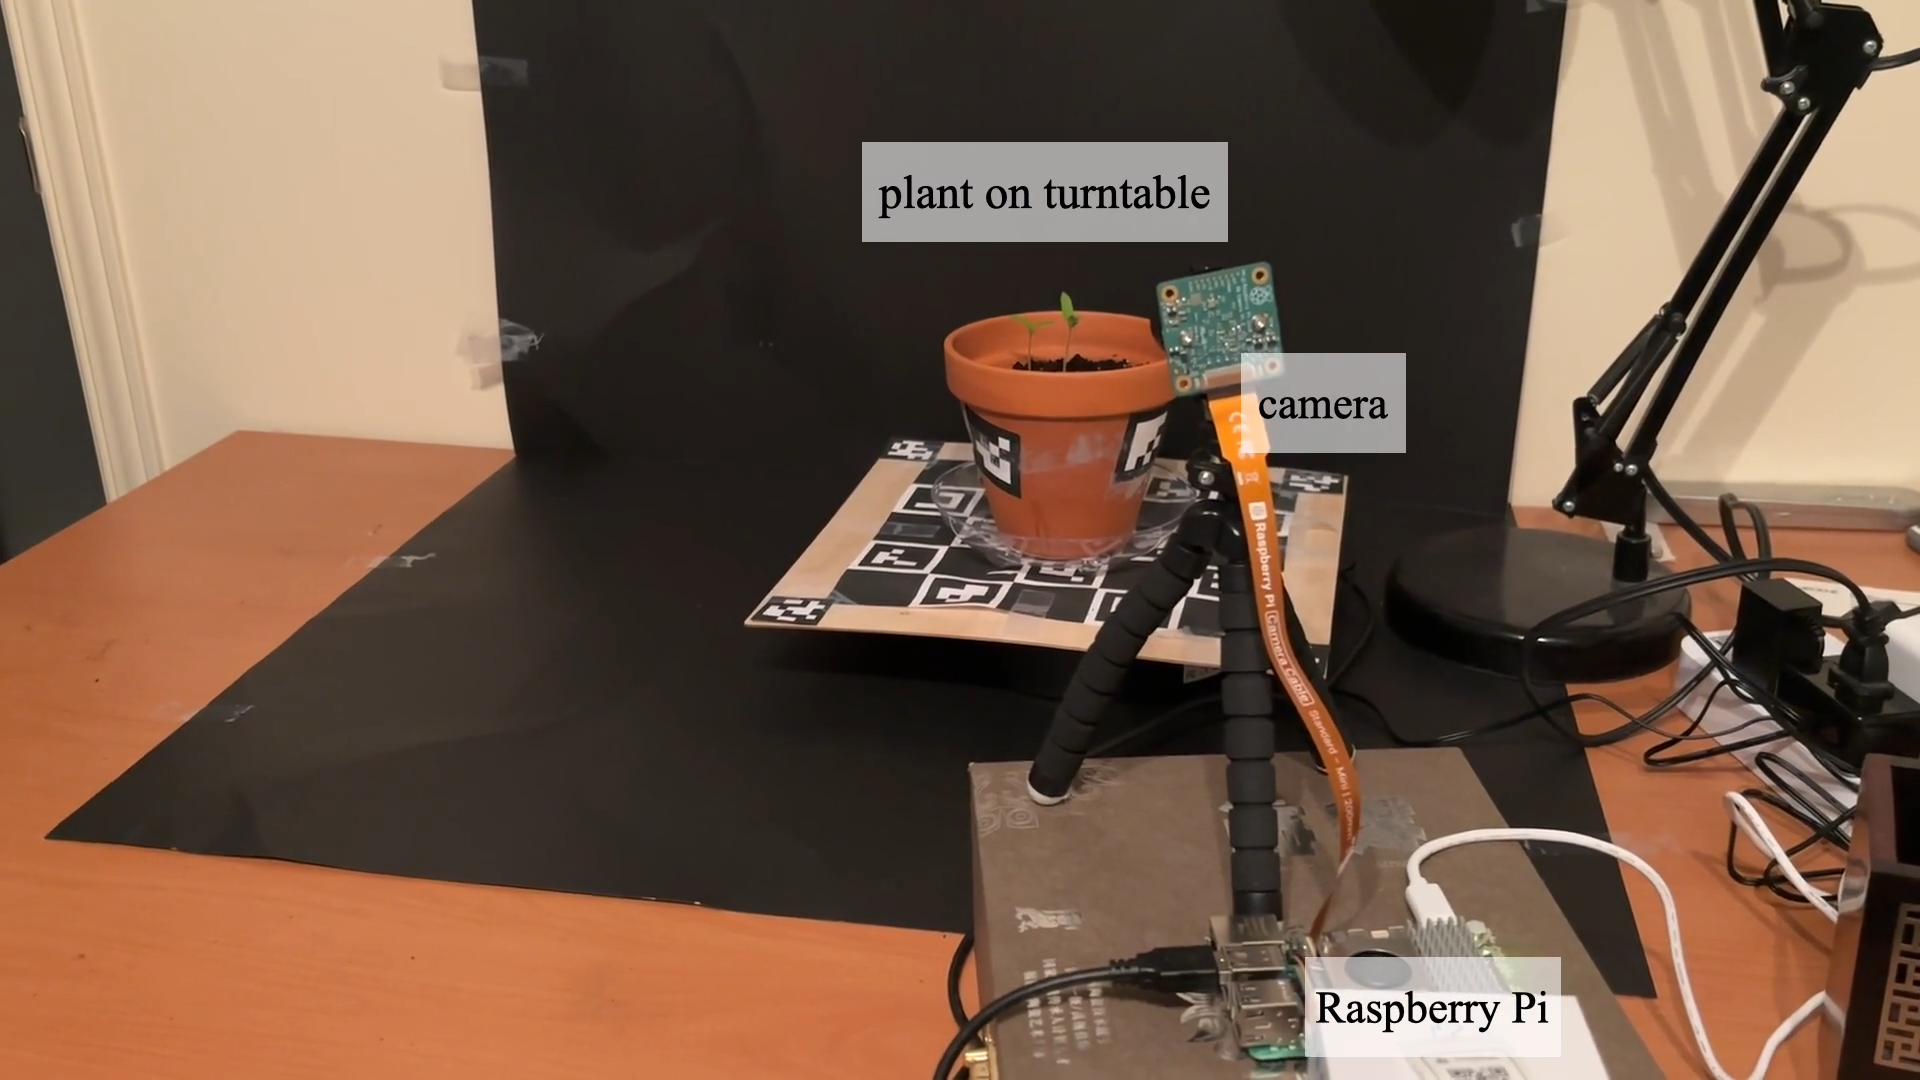
And we can finally watch it. Gaussian-splat reconstruction turns a cheap turntable-and-camera rig into 4D video of a plant growing in full 3D — geometry you can rotate, scrub, and measure.
From Grow with the Flow: 4D Reconstruction of Growing Plants with Gaussian Flow Fields:
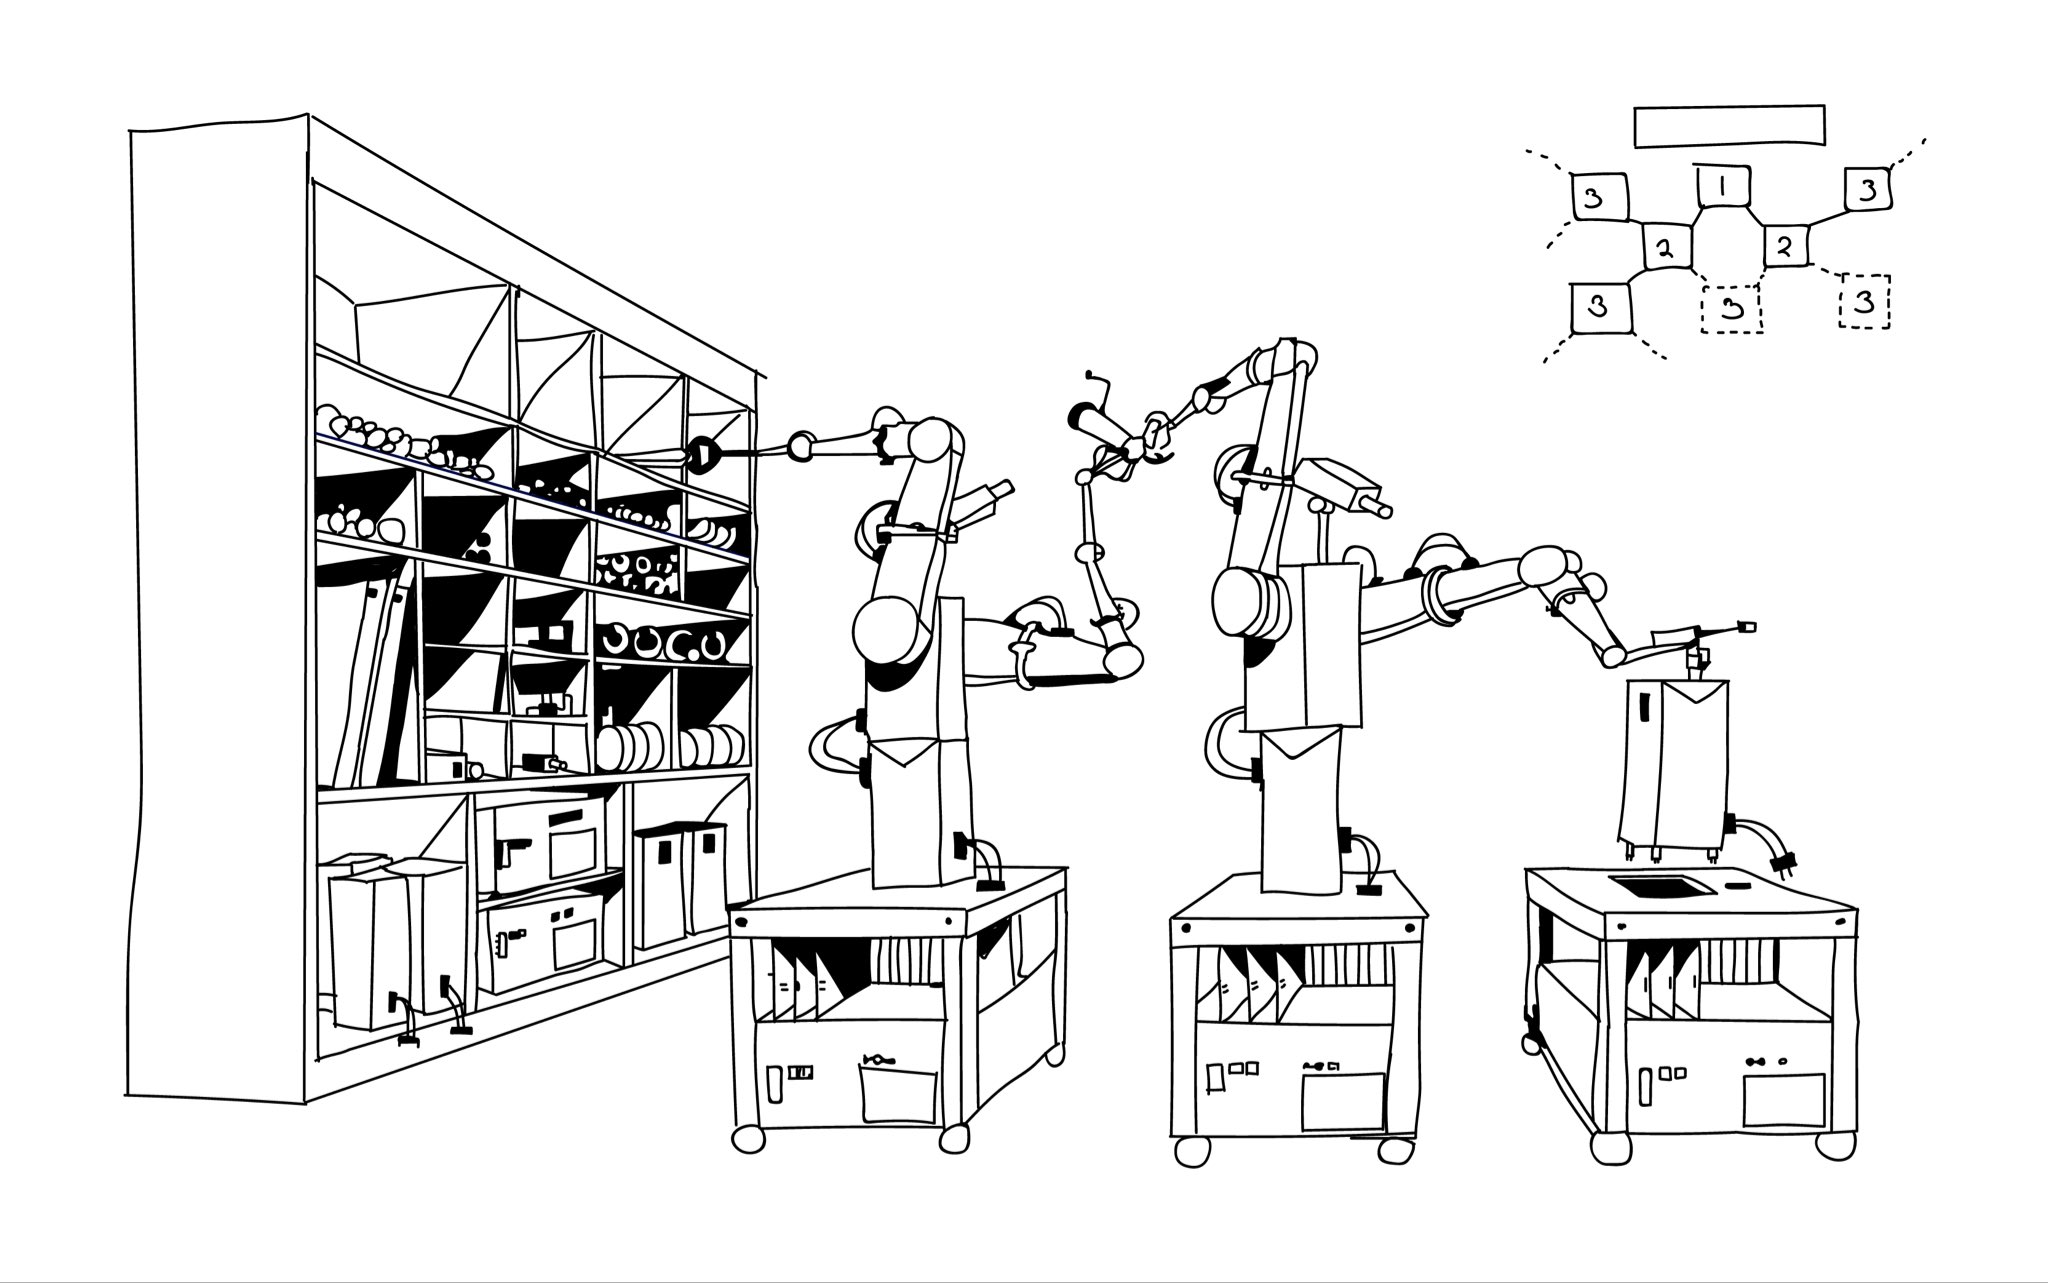
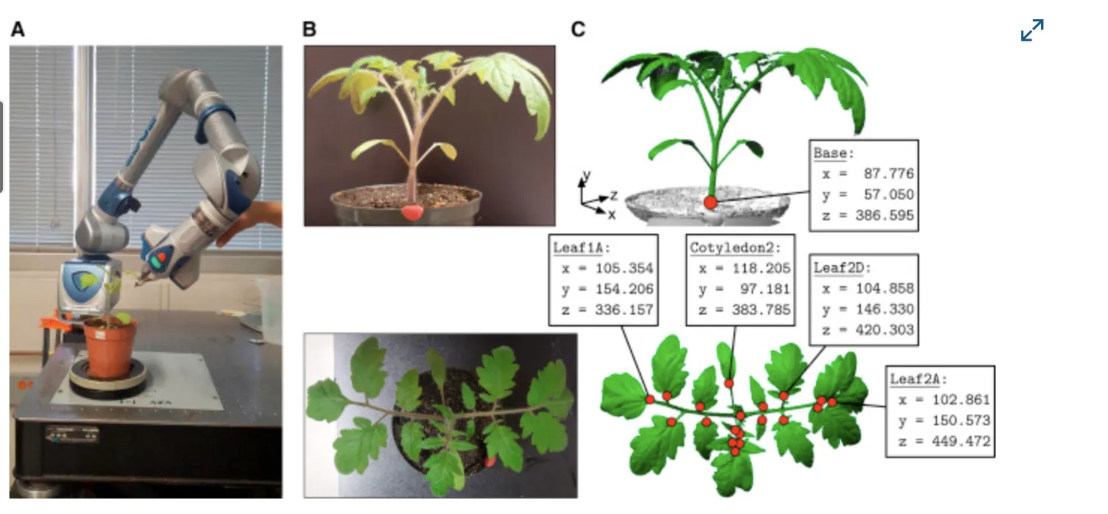
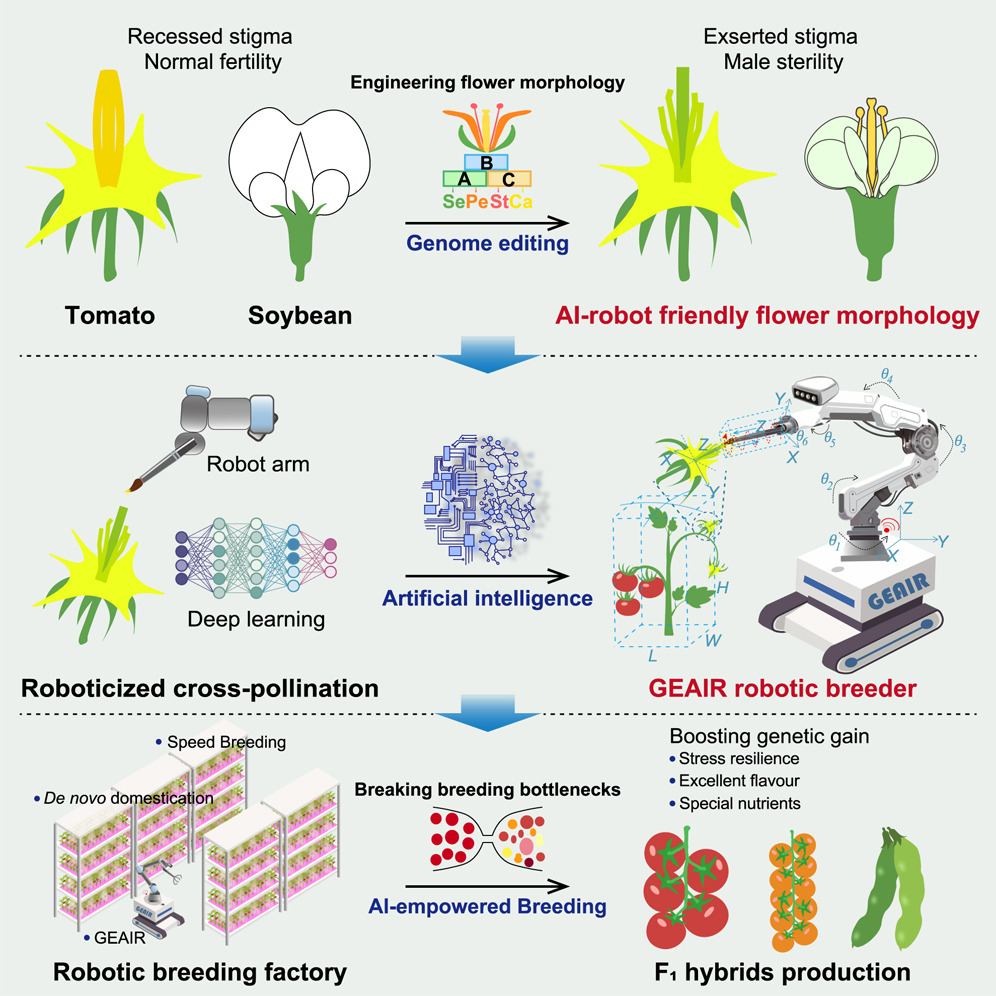
Once growth is measurable it becomes optimisable. You can score a real tomato plant against the theoretically ideal network for moving water and light — and, increasingly, hand the breeding loop itself to a robot arm and a model.
Hormone transport networks.
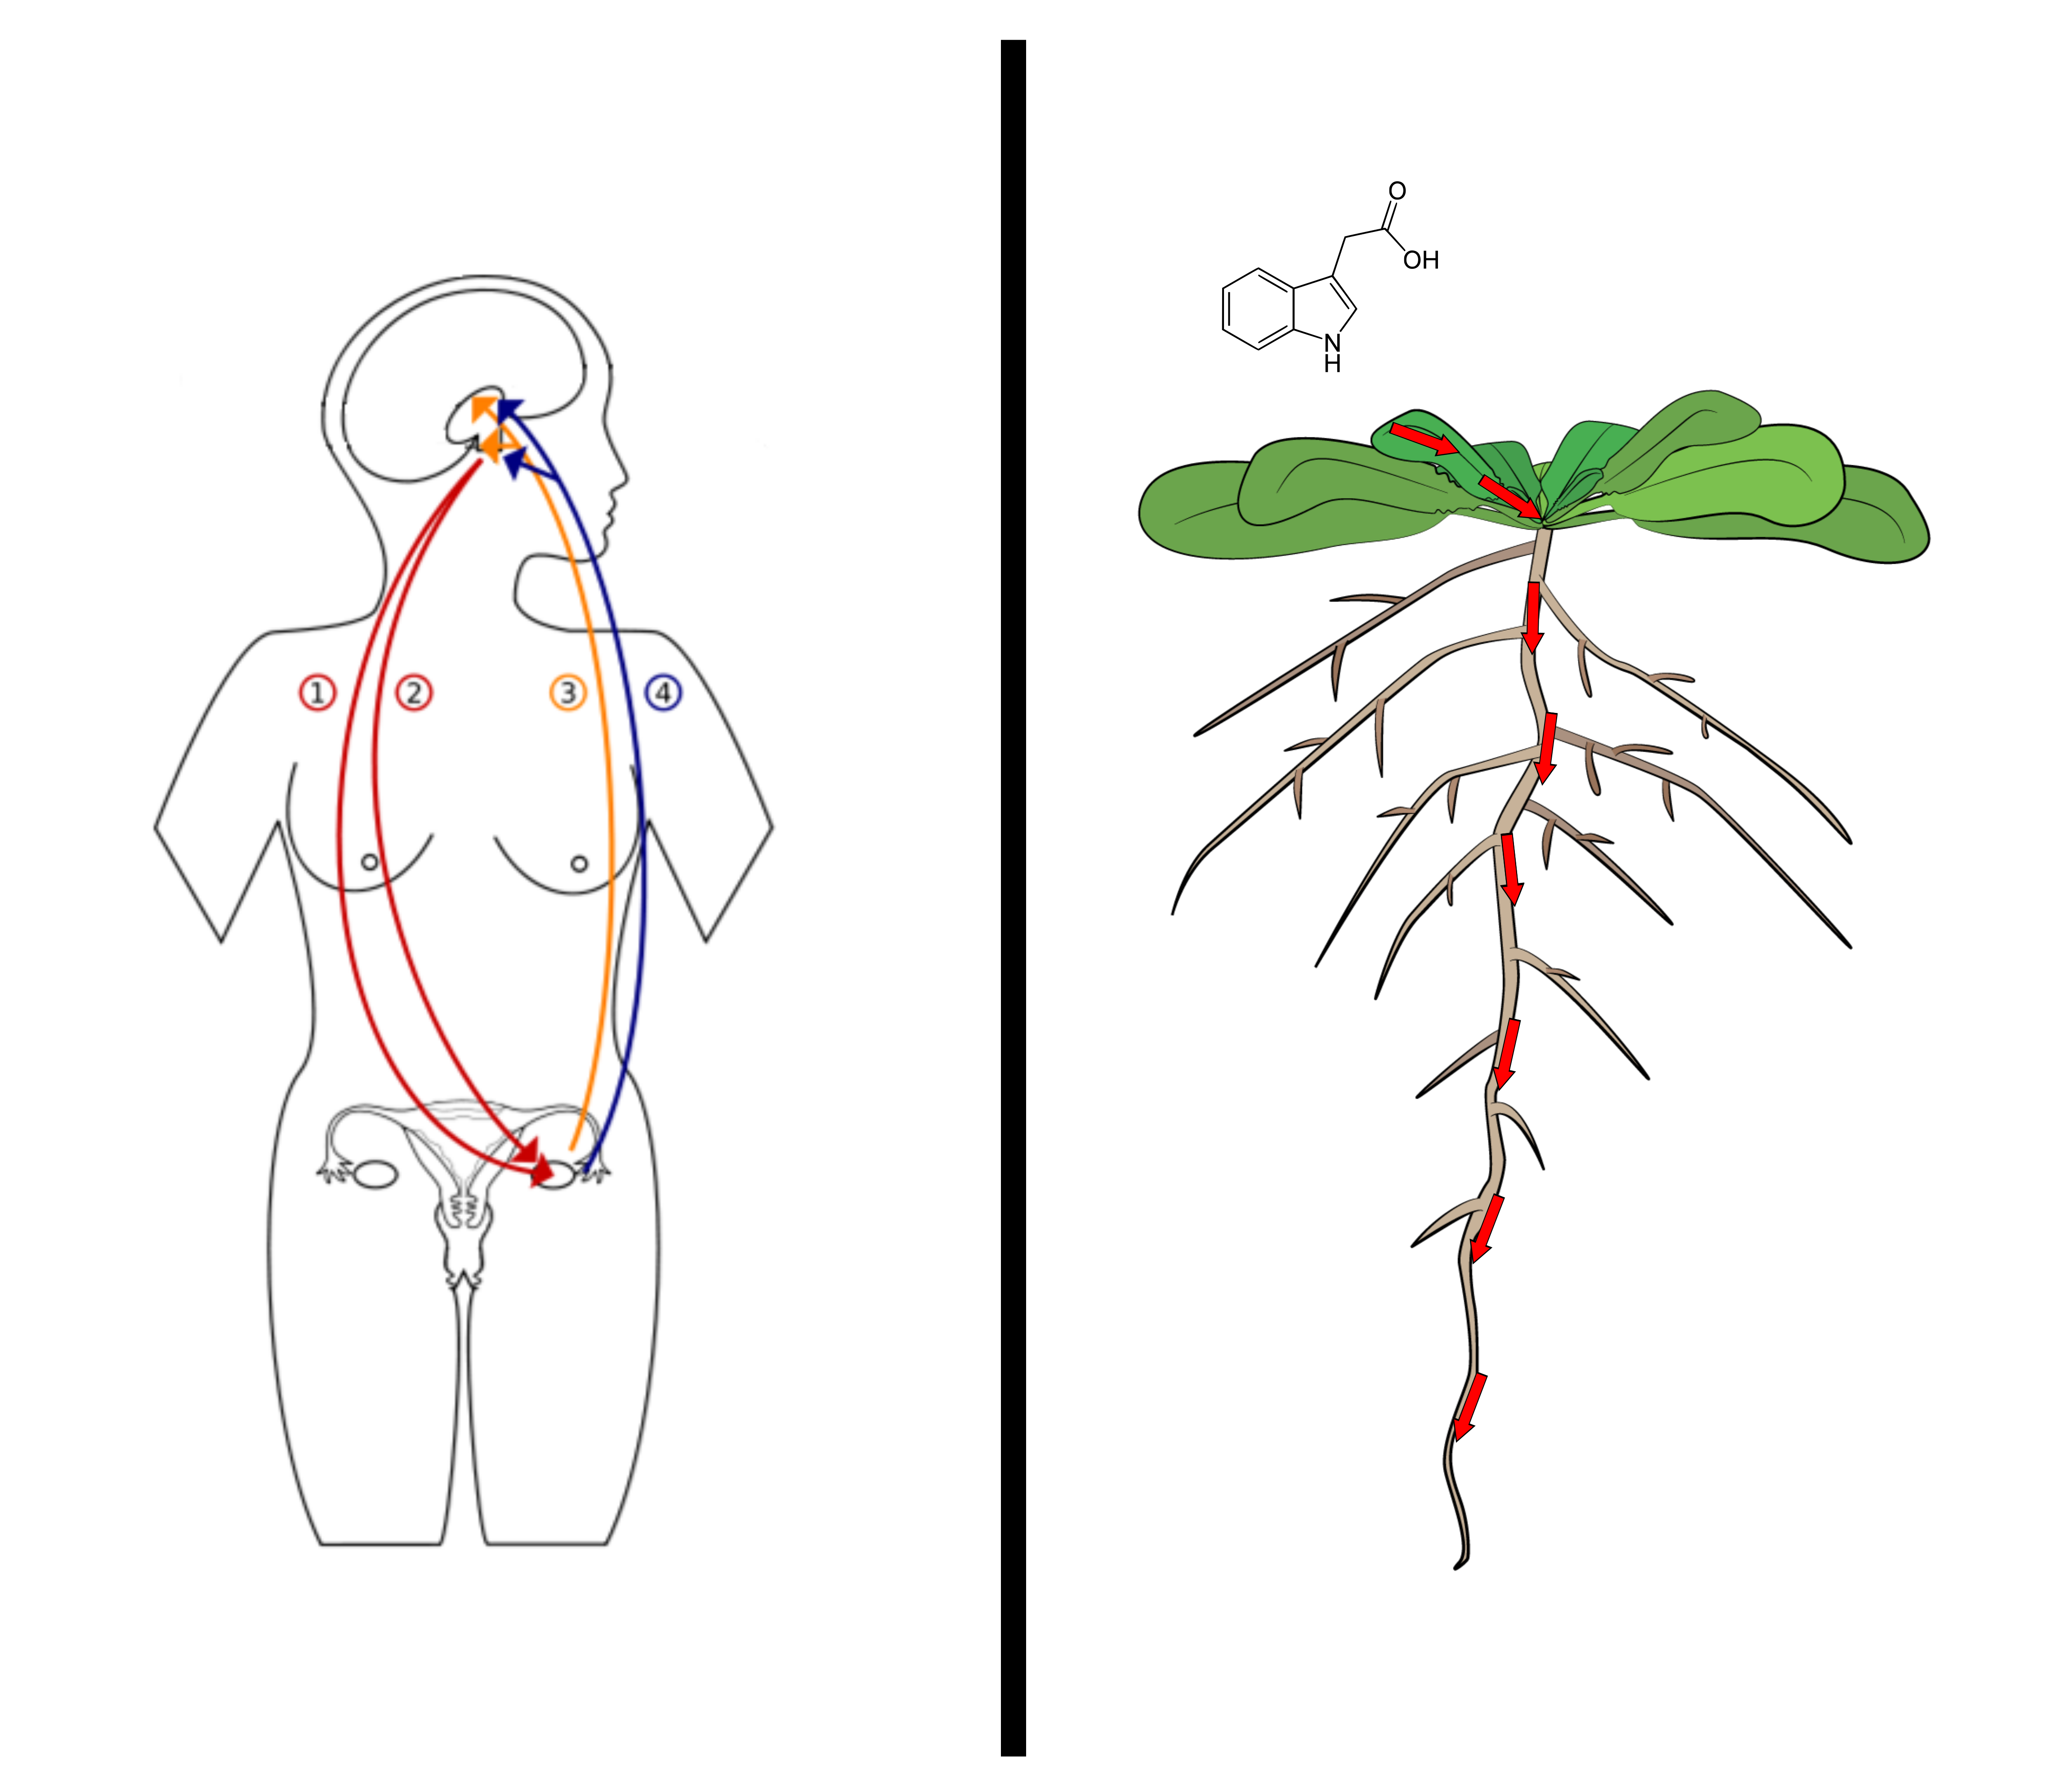
Plants and animals independently solved the same problem: how to send a signal across a body with no brain in the middle. We use nerves and a bloodstream of hormones; a plant pumps auxin, cell to cell, down its root. Drawn side by side, the two wiring diagrams rhyme.
Form is never free. It's written against two things that don't negotiate: physics, and four billion years of history. These are the diagrams about the constraints.
Nature and evolution.
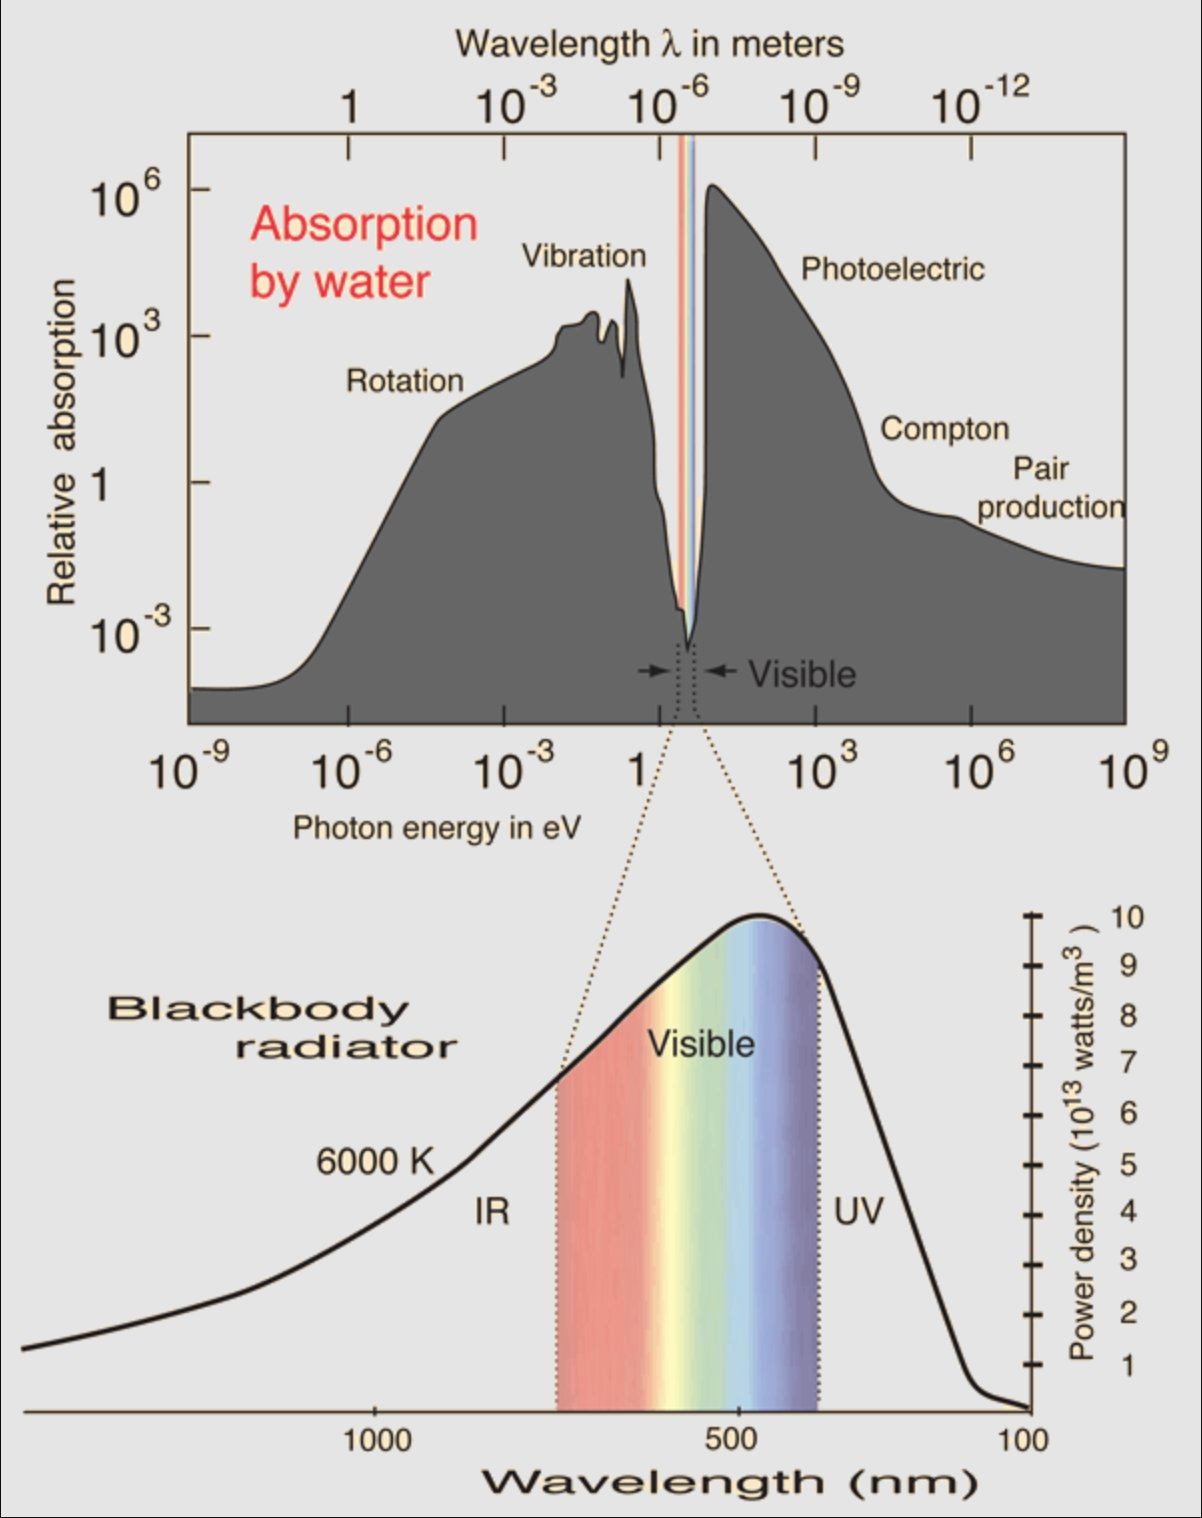
Life evolved to see through water
Of the entire electromagnetic spectrum, there's one narrow band where water happens to be transparent — and it's almost exactly the band we call visible light. Our eyes didn't pick the rainbow; the medium picked it for us. Vision is the shape of a constraint.
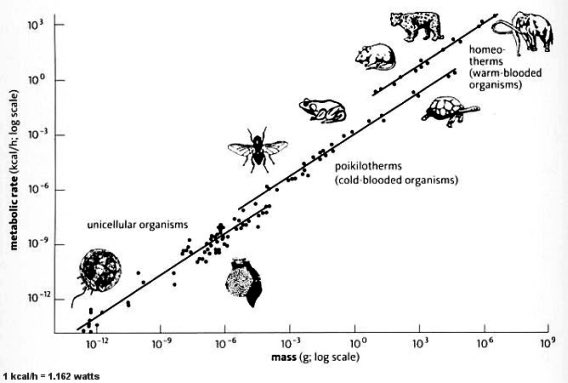
Then there's Kleiber's law, which still floors me. Plot metabolic rate against body mass for everything from a single-celled microbe to a blue whale, and roughly twenty-four orders of magnitude fall onto one straight line. Life is built to a power law nobody agreed to.
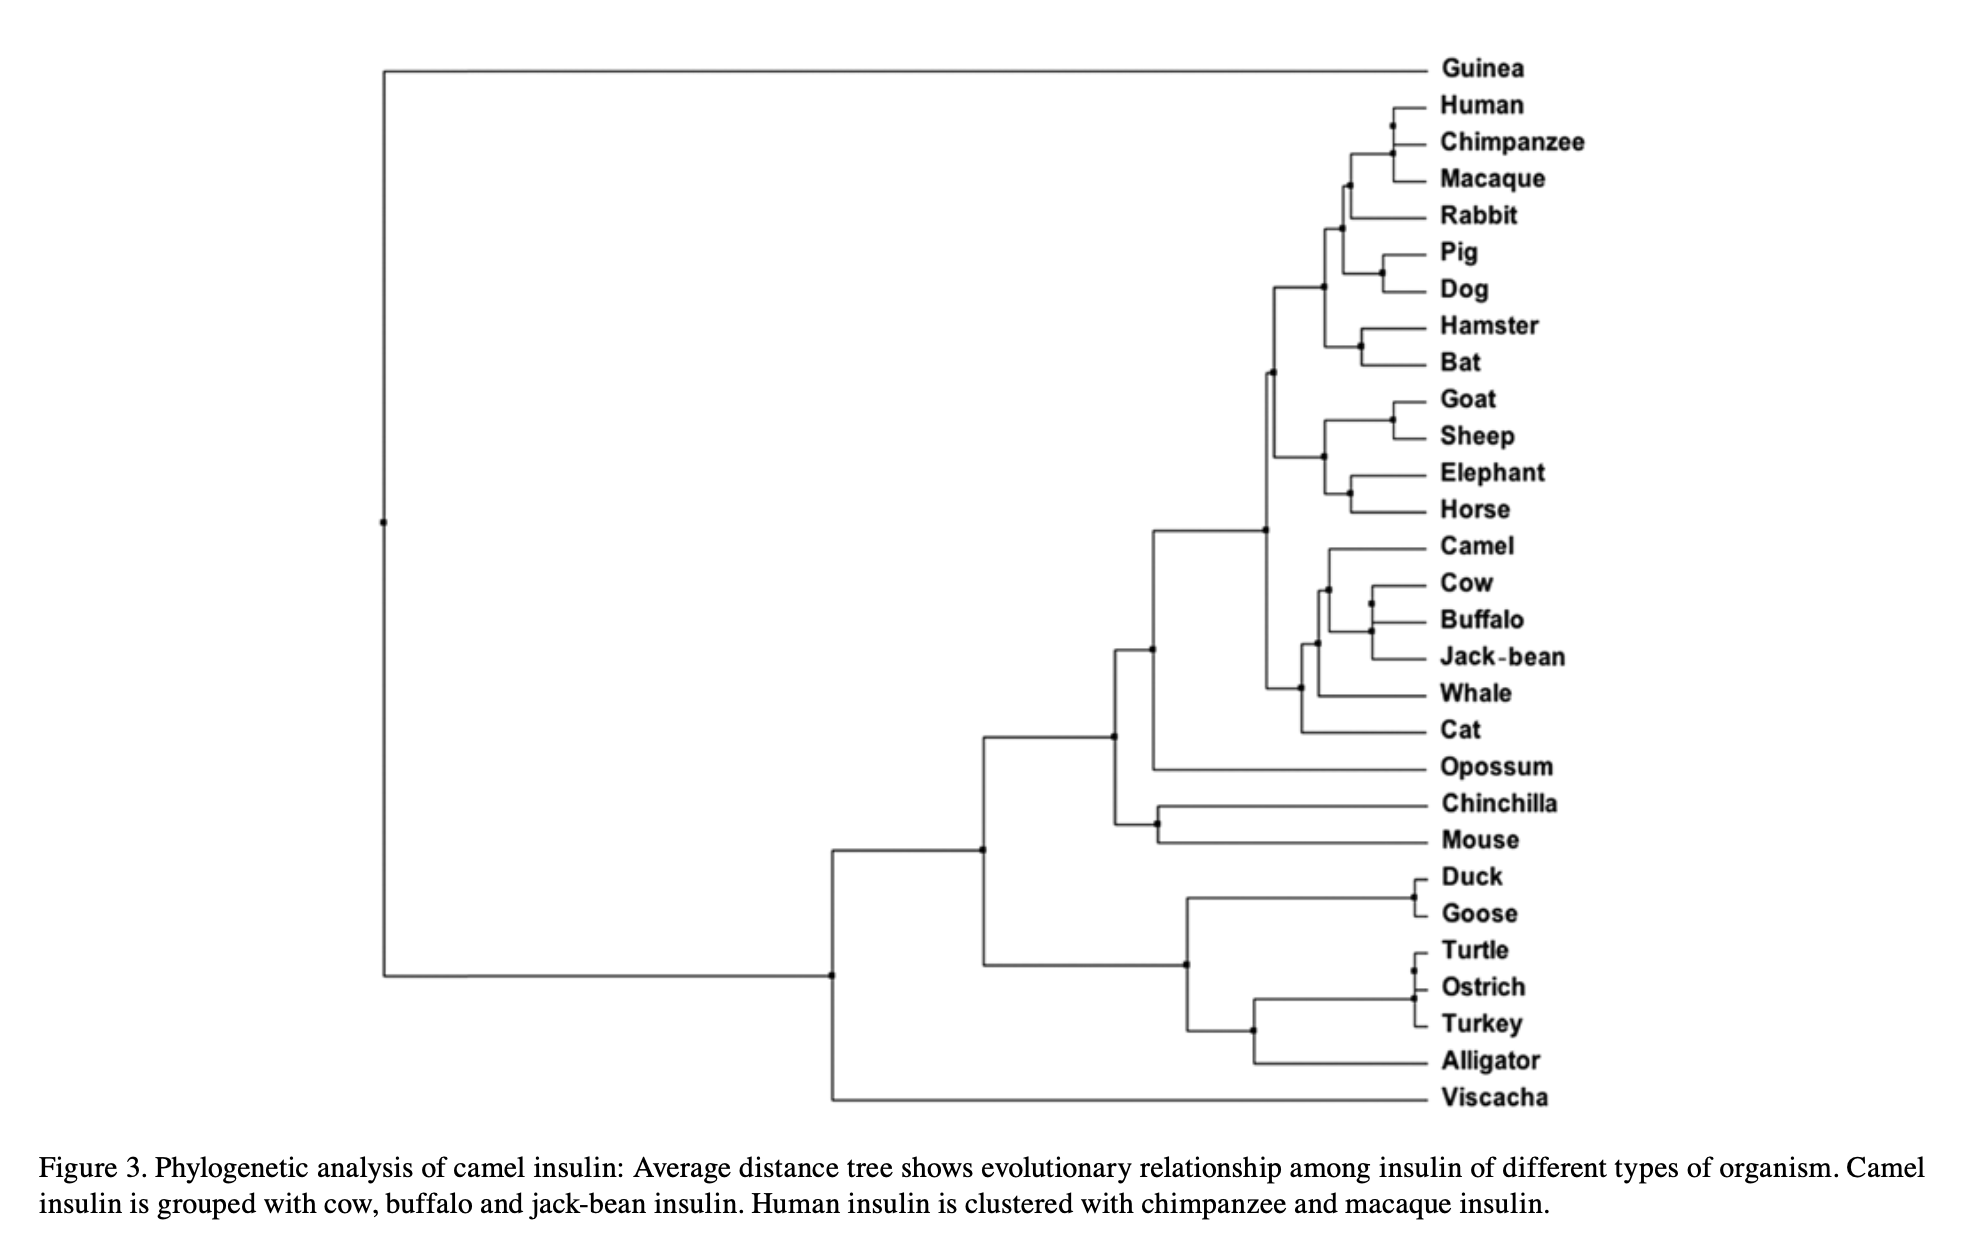
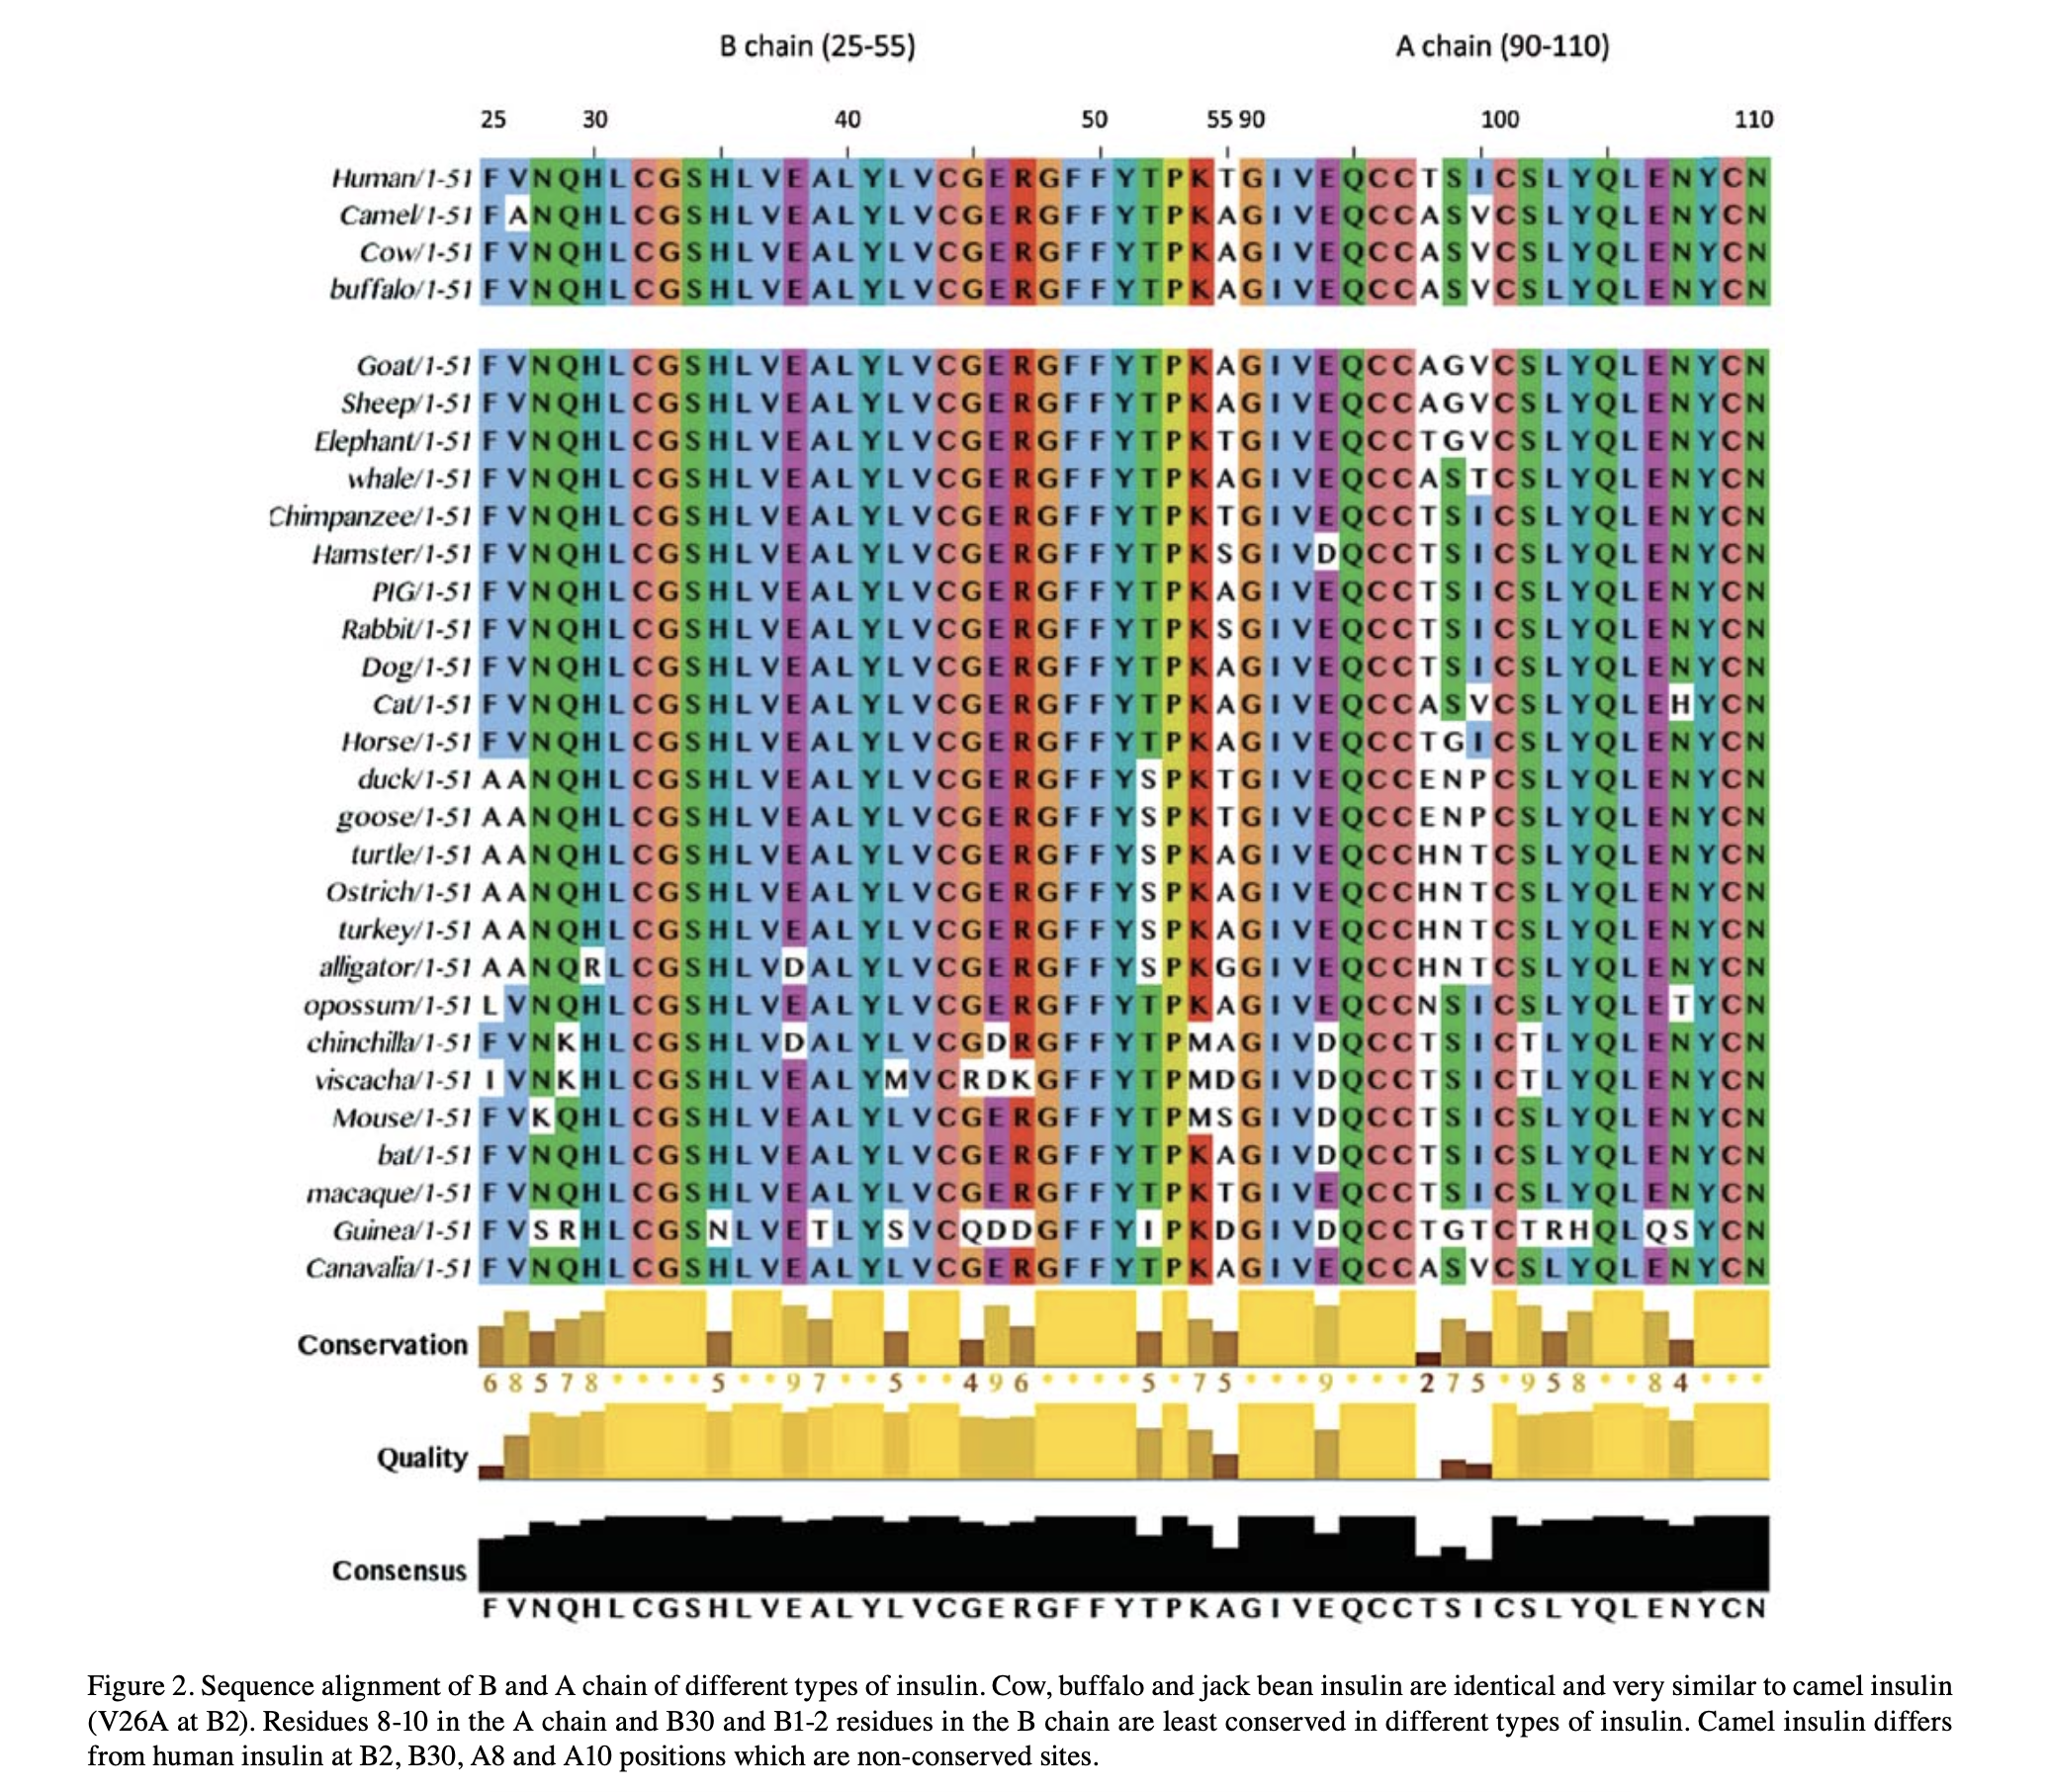
And history leaves a readable trace. Insulin is so essential it has barely changed: line the hormone up across species and most letters are identical. From the handful of differences you can rebuild the tree of life — human clusters with chimp and macaque, camel with cow and buffalo. One small protein remembers the whole phylogeny.
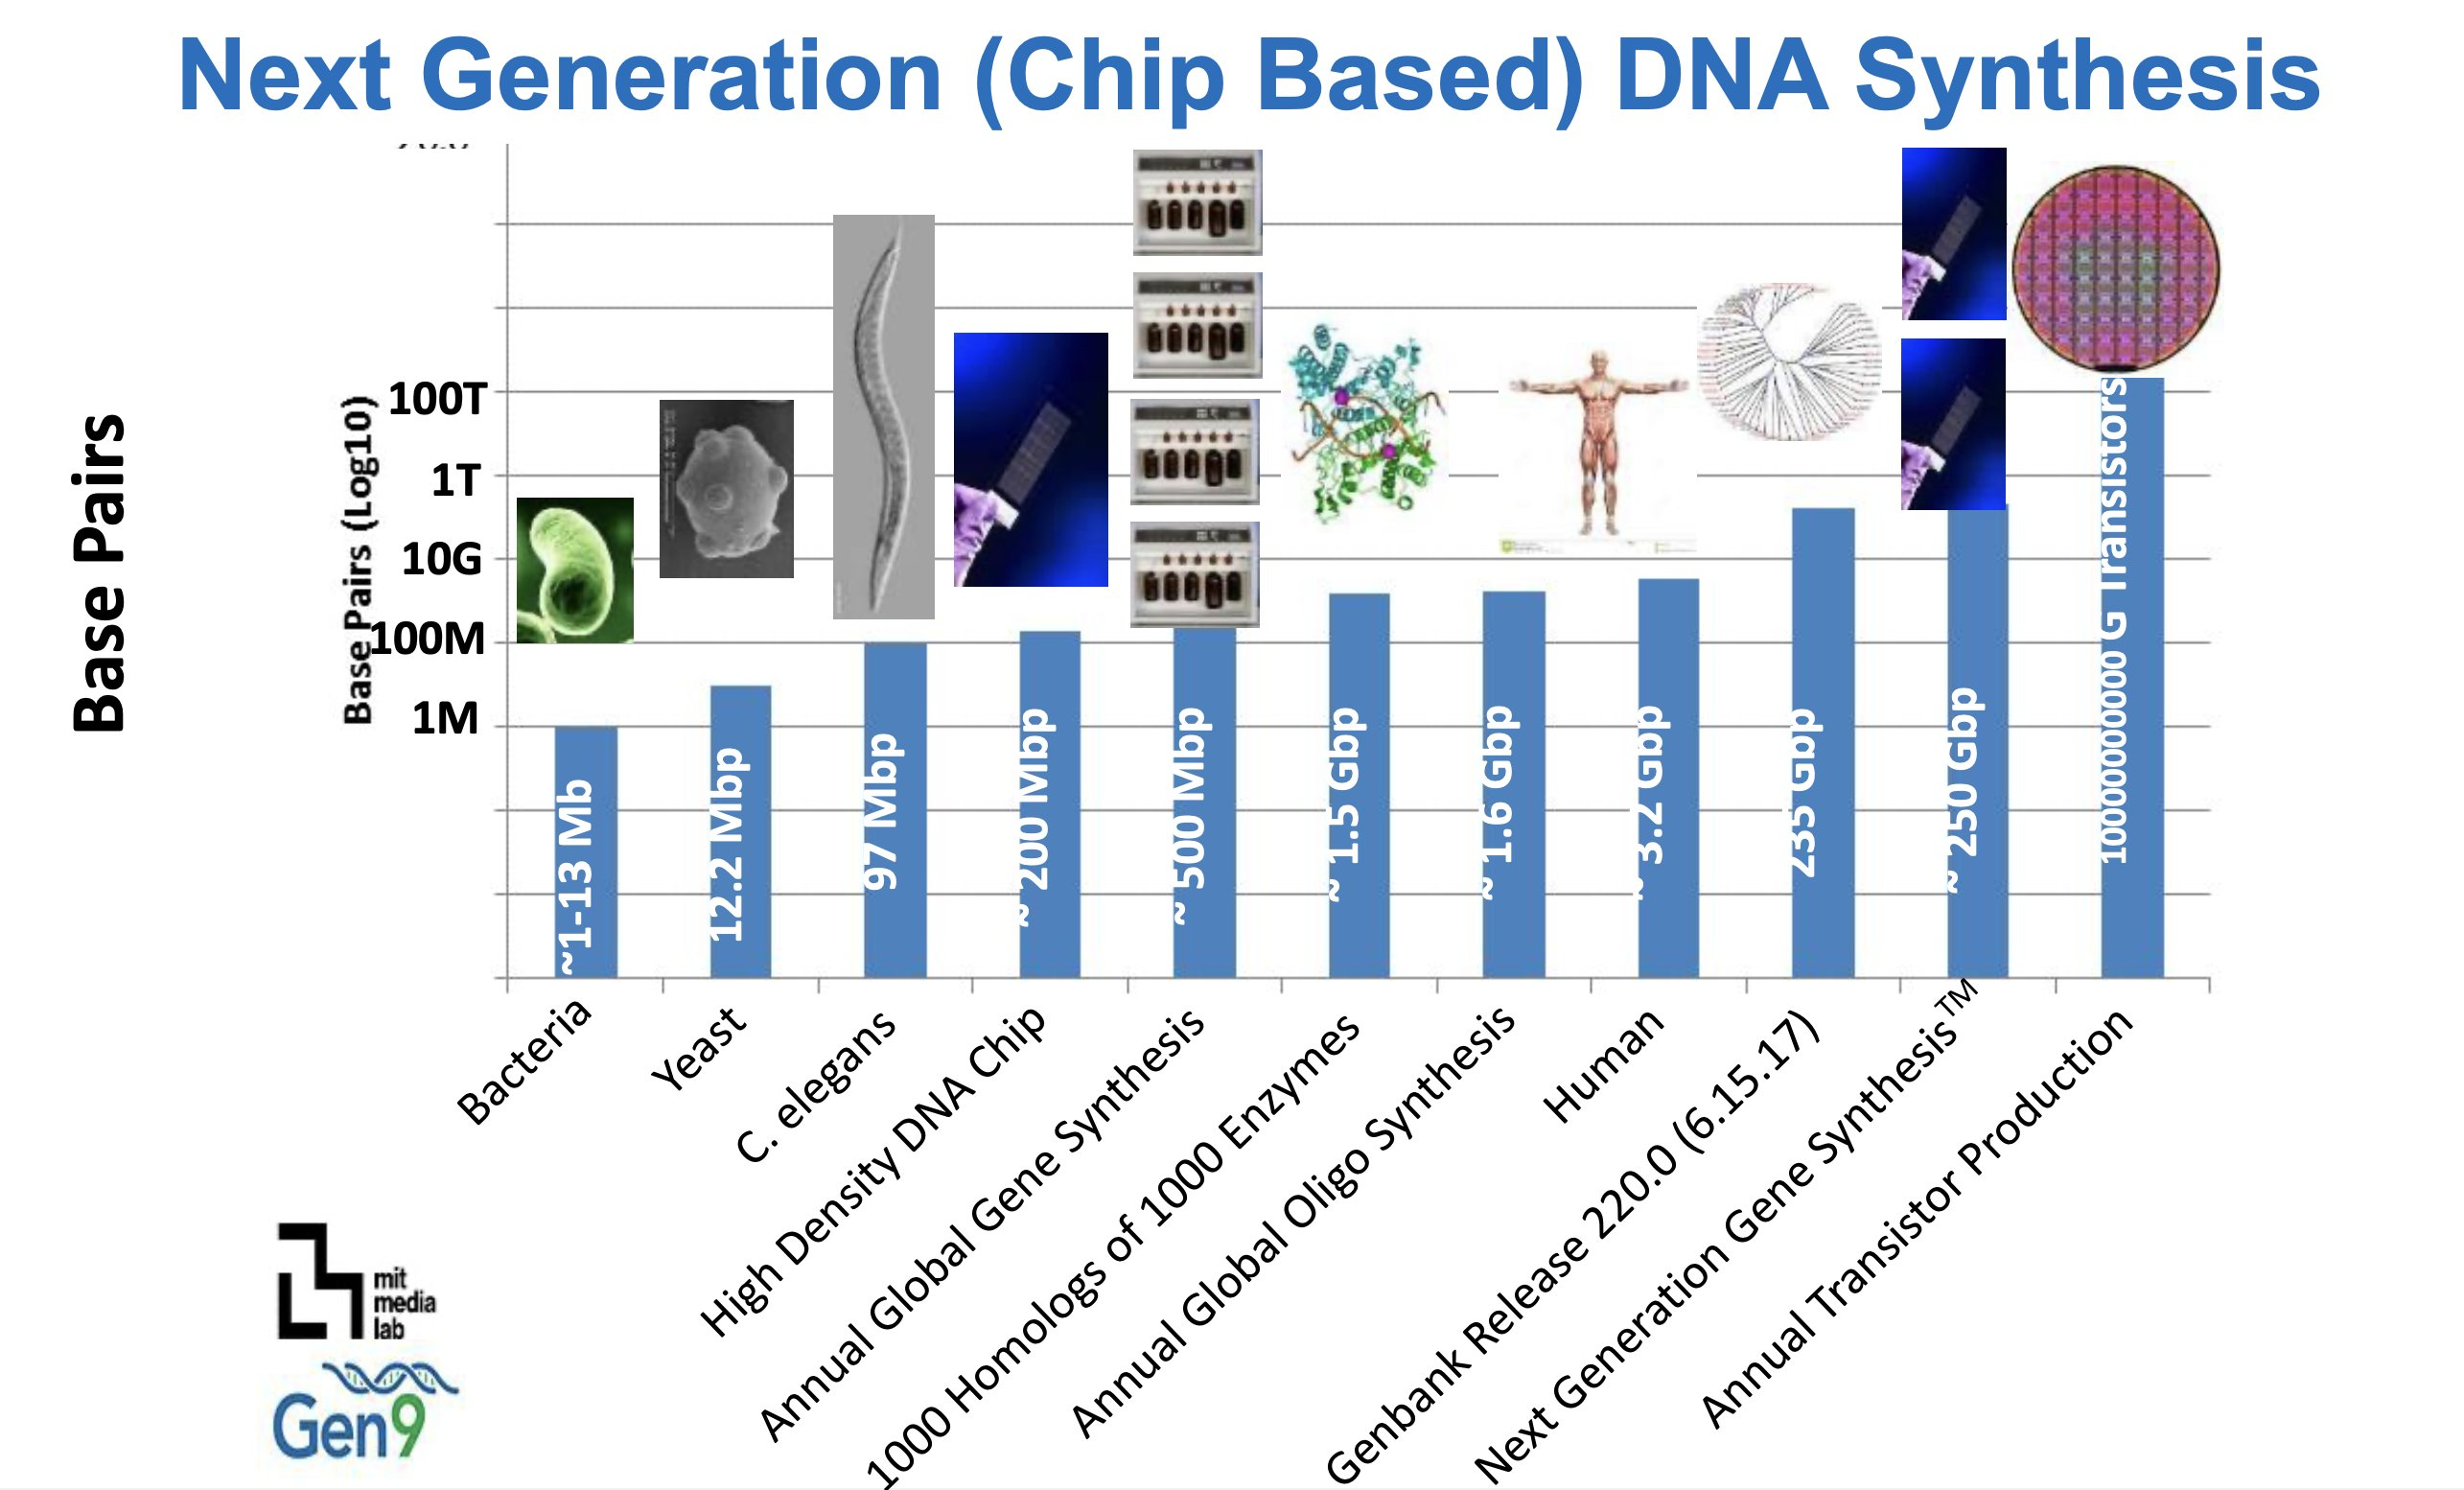
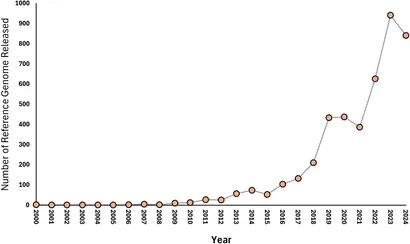
It is a staggering amount of information — genomes run from megabases to gigabases — and in two decades we've gone from sequencing almost nothing to a near-vertical curve of reference genomes.
Images of nature
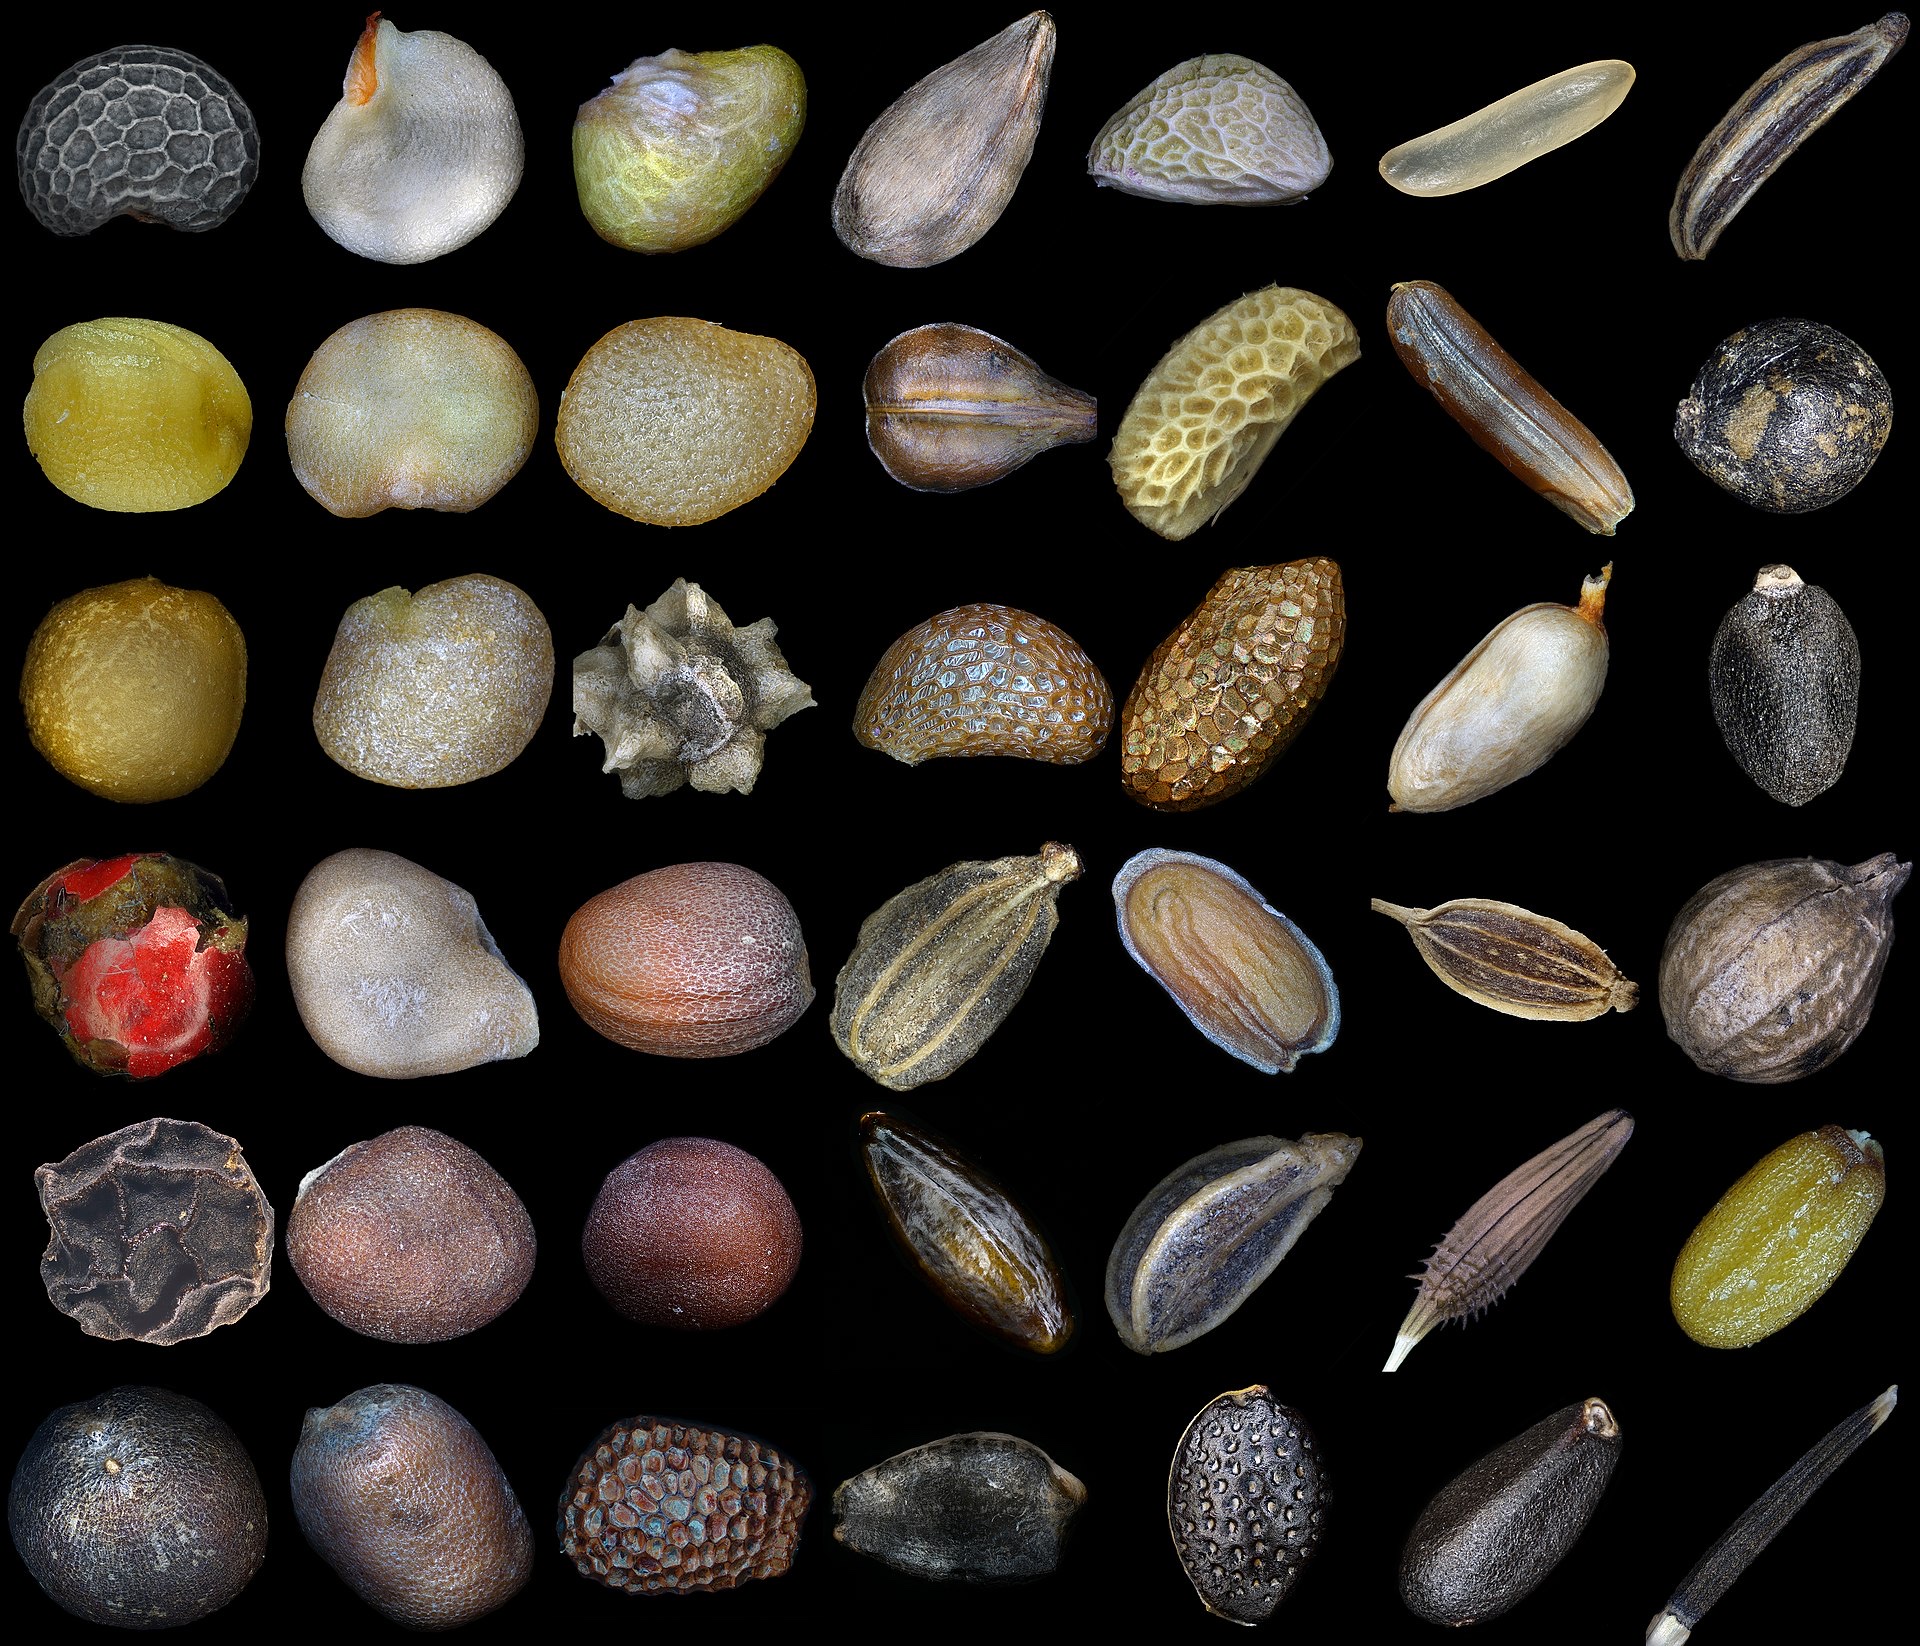
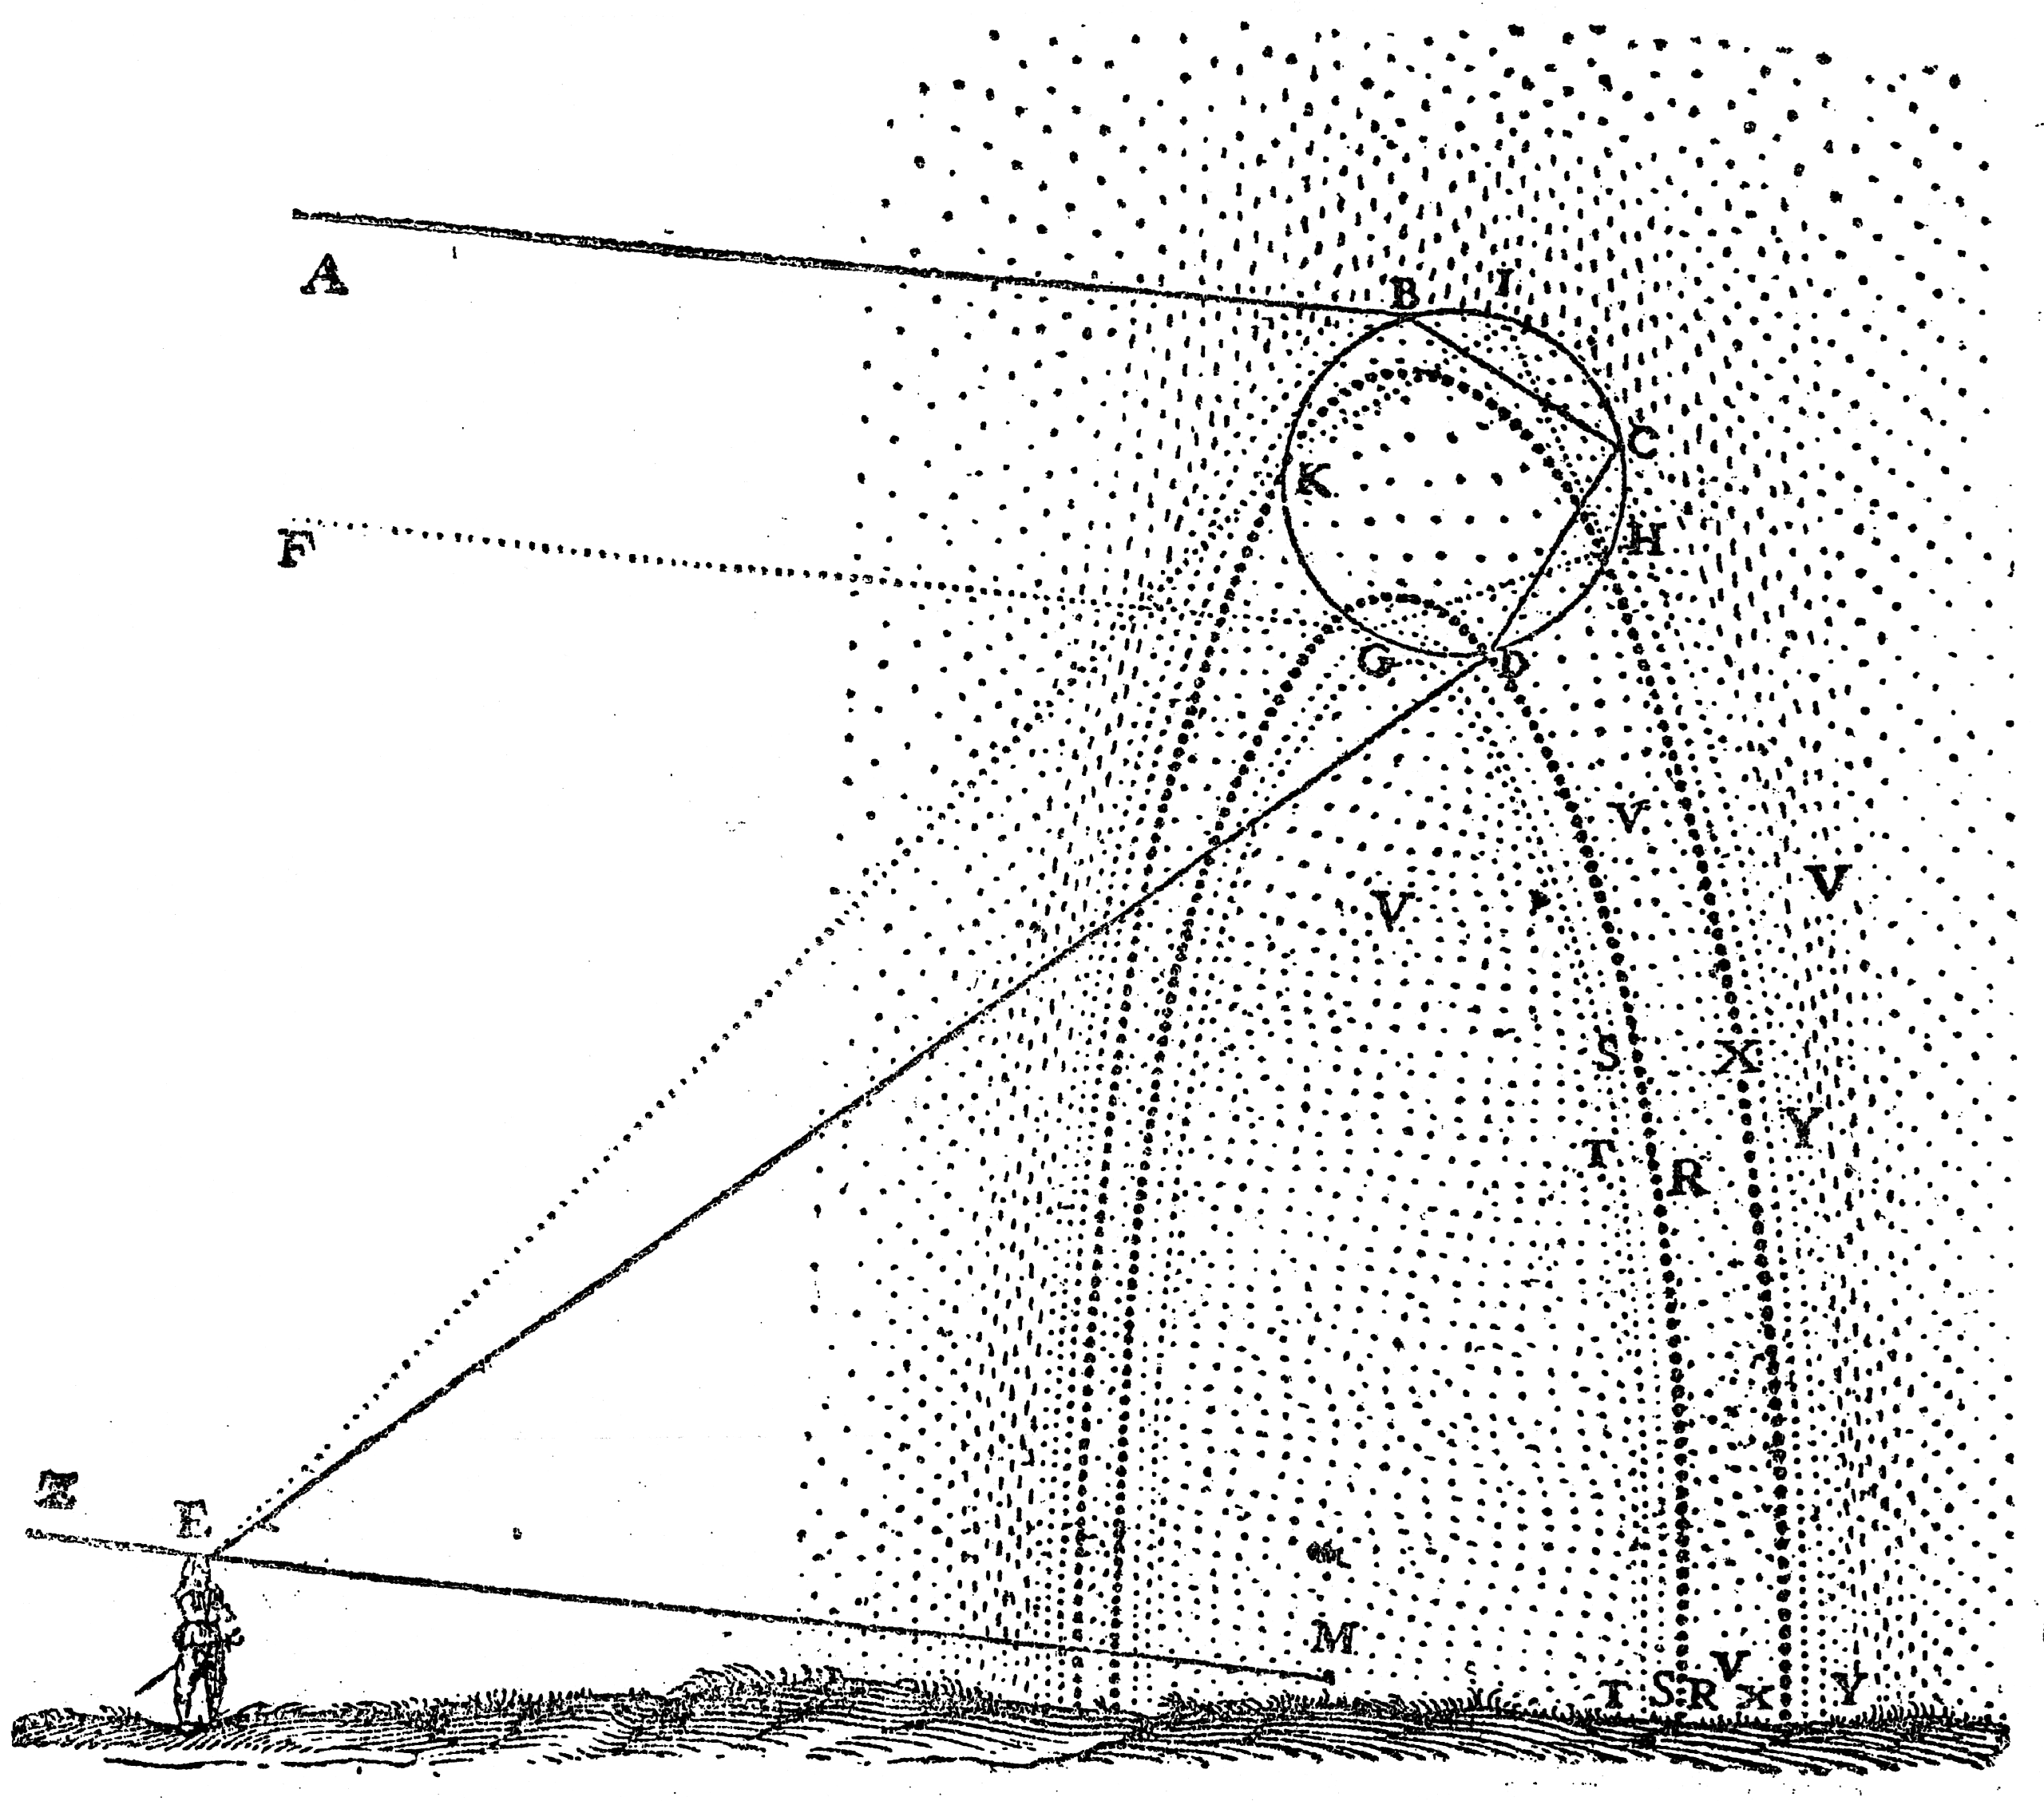
Some of it I keep just because it's beautiful — the sheer variety a few genes can throw off. A tray of seeds, each a different solution to the same packing problem; a 1637 engraving where Descartes works out the rainbow from first principles, refraction and reflection inside a single drop.
Keep zooming. Below the cell, biology stops being biology and becomes chemistry and geometry — a handful of small rules that everything upstream inherits.
Protein folding.
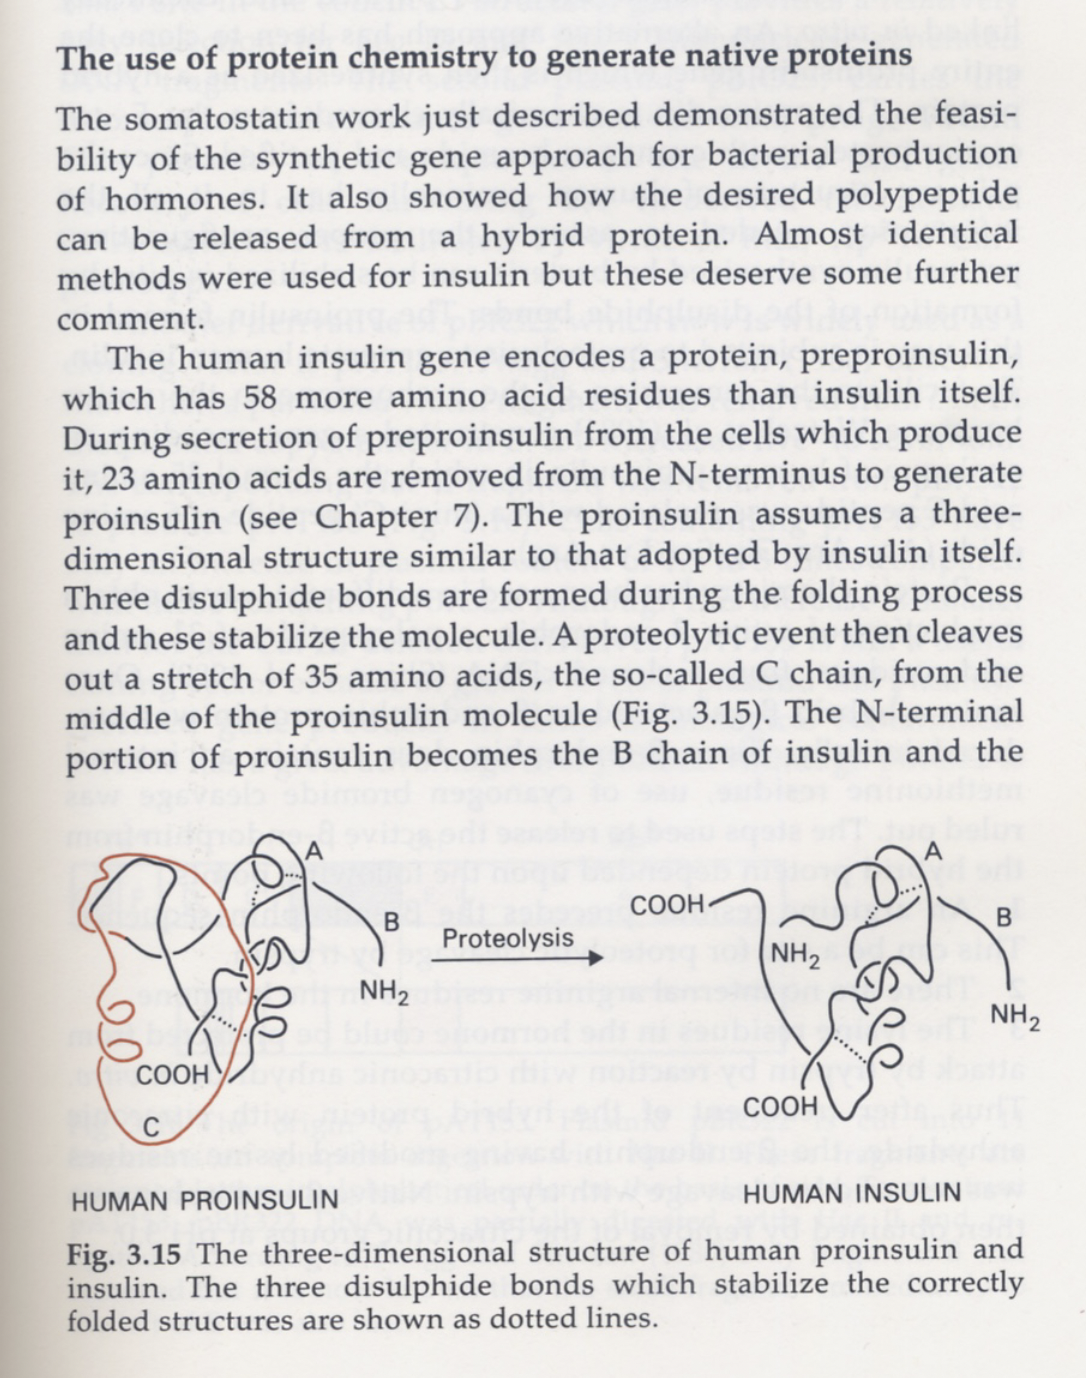
A protein is a 1D chain that folds into a 3D machine, and the fold is where the function lives. Insulin is the small, beautiful case: it's built long, as proinsulin; three disulfide bonds pin the fold in place; then a chunk in the middle — the C-peptide — is snipped out. The shape comes first, the cut comes second.
Structural engineering, as done by Life.
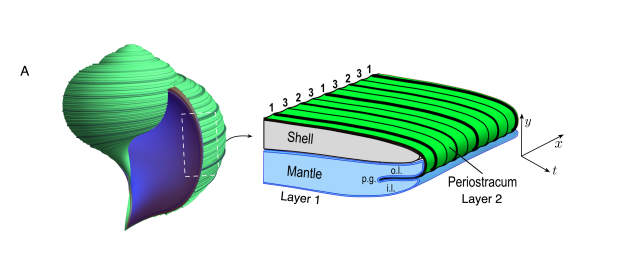
Even a seashell is a generative model. The mantle — a thin lip of tissue — secretes layer on layer, and a simple local rule plus growth produces the logarithmic spiral. The shell is a recording of the algorithm that built it.
Images of proteins.
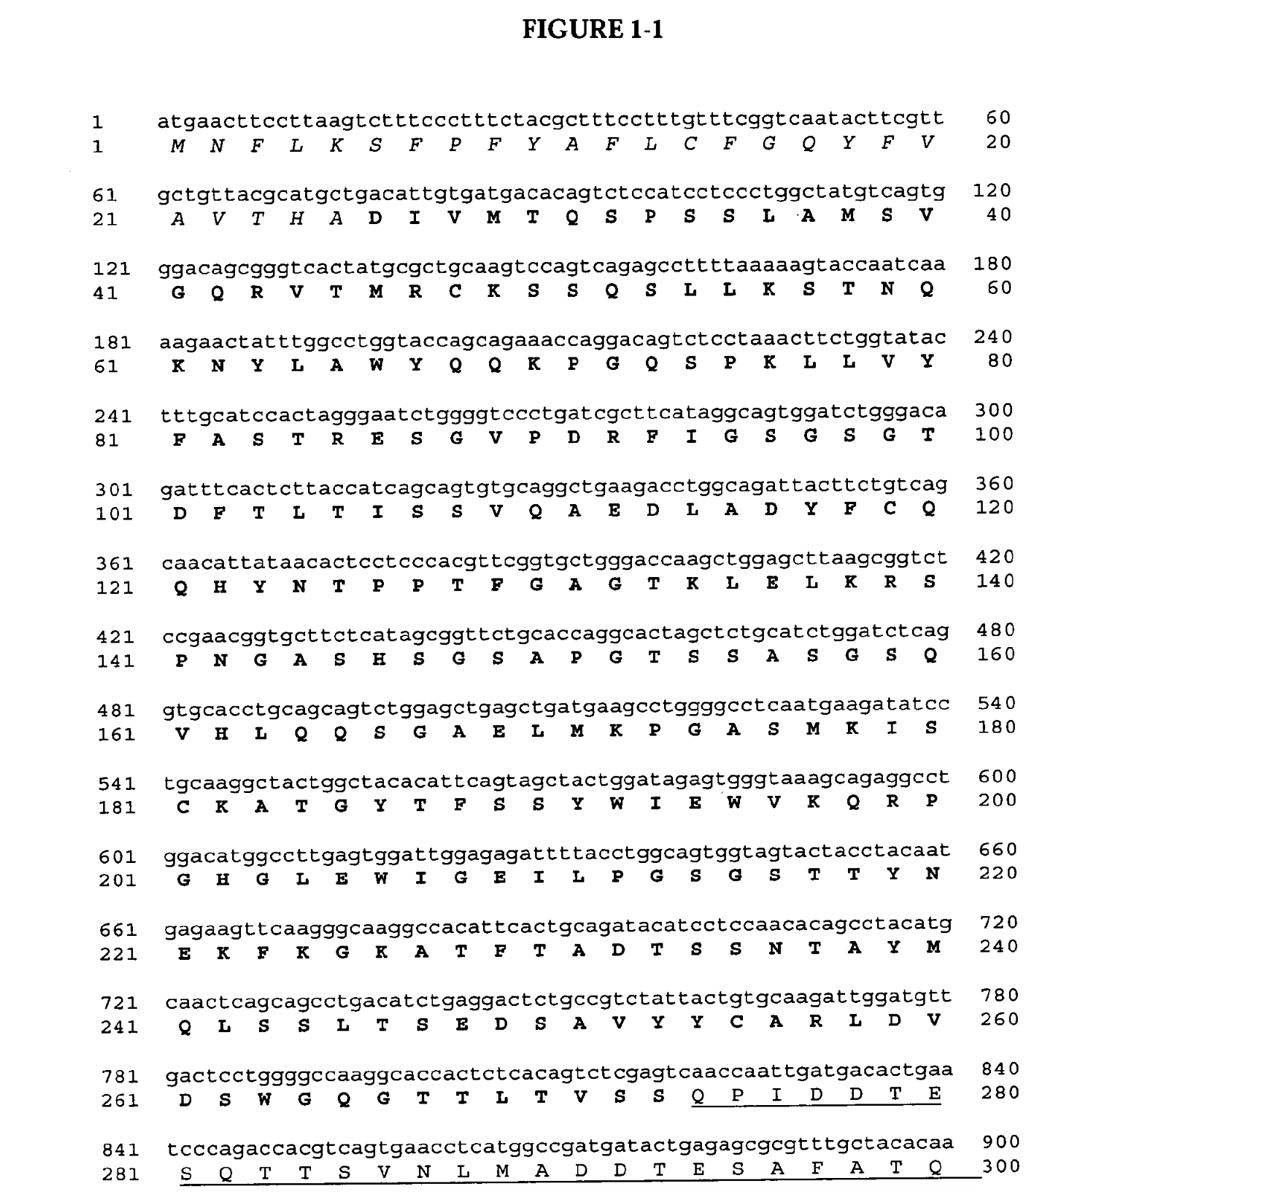
And here's the source code itself: an insulin gene, printed straight out of a patent. Pages of A, C, G and T that a cell reads as a single instruction — build this.
Images of chemistry and physics.
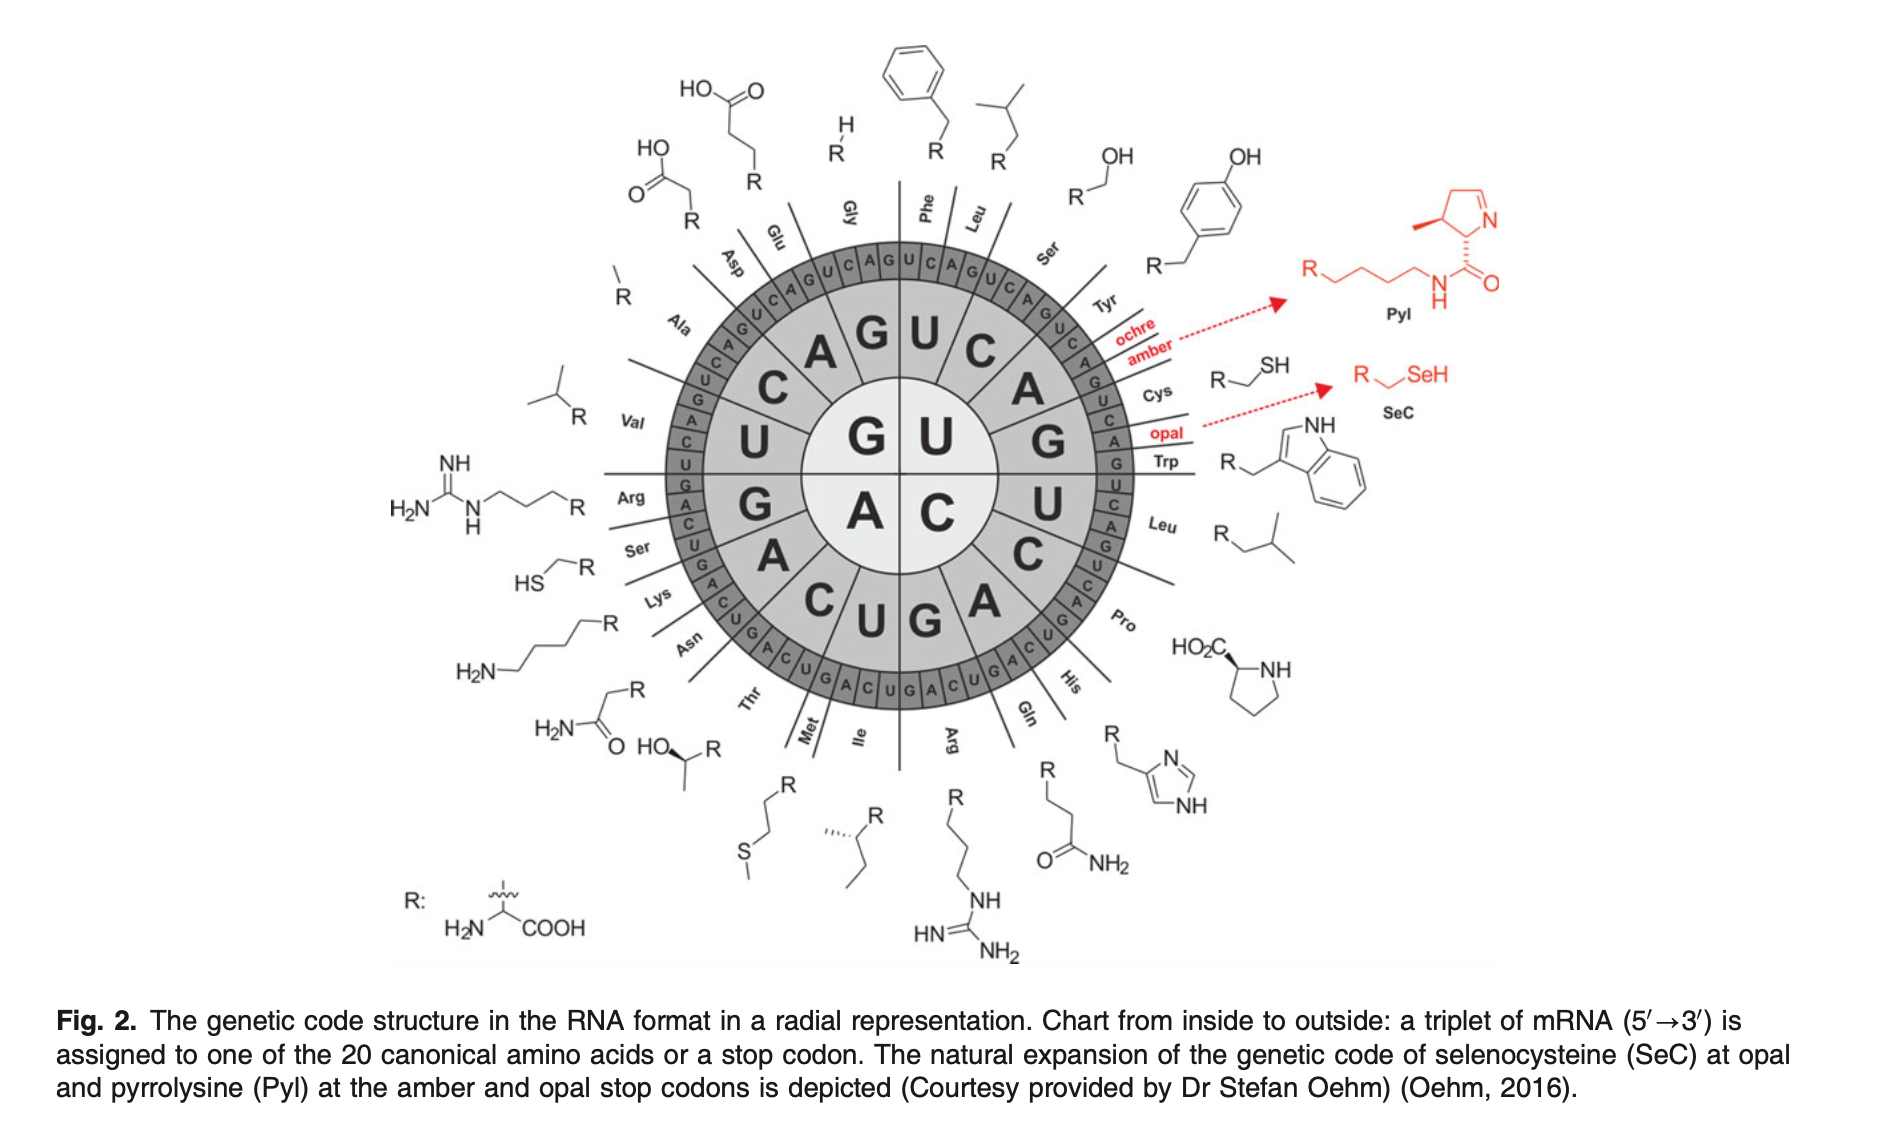
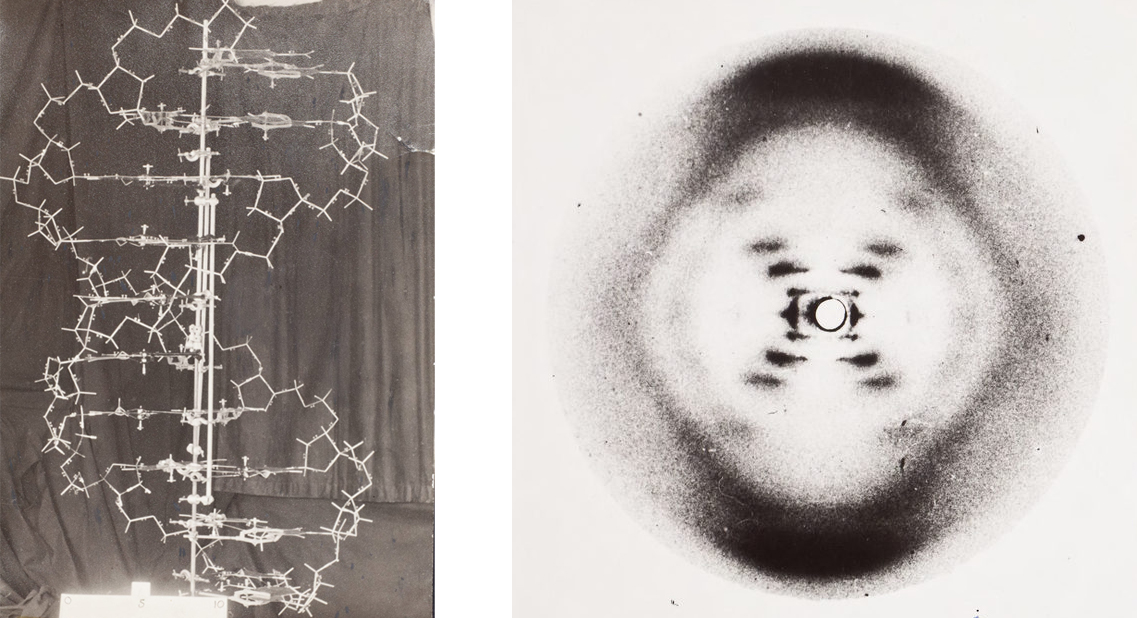
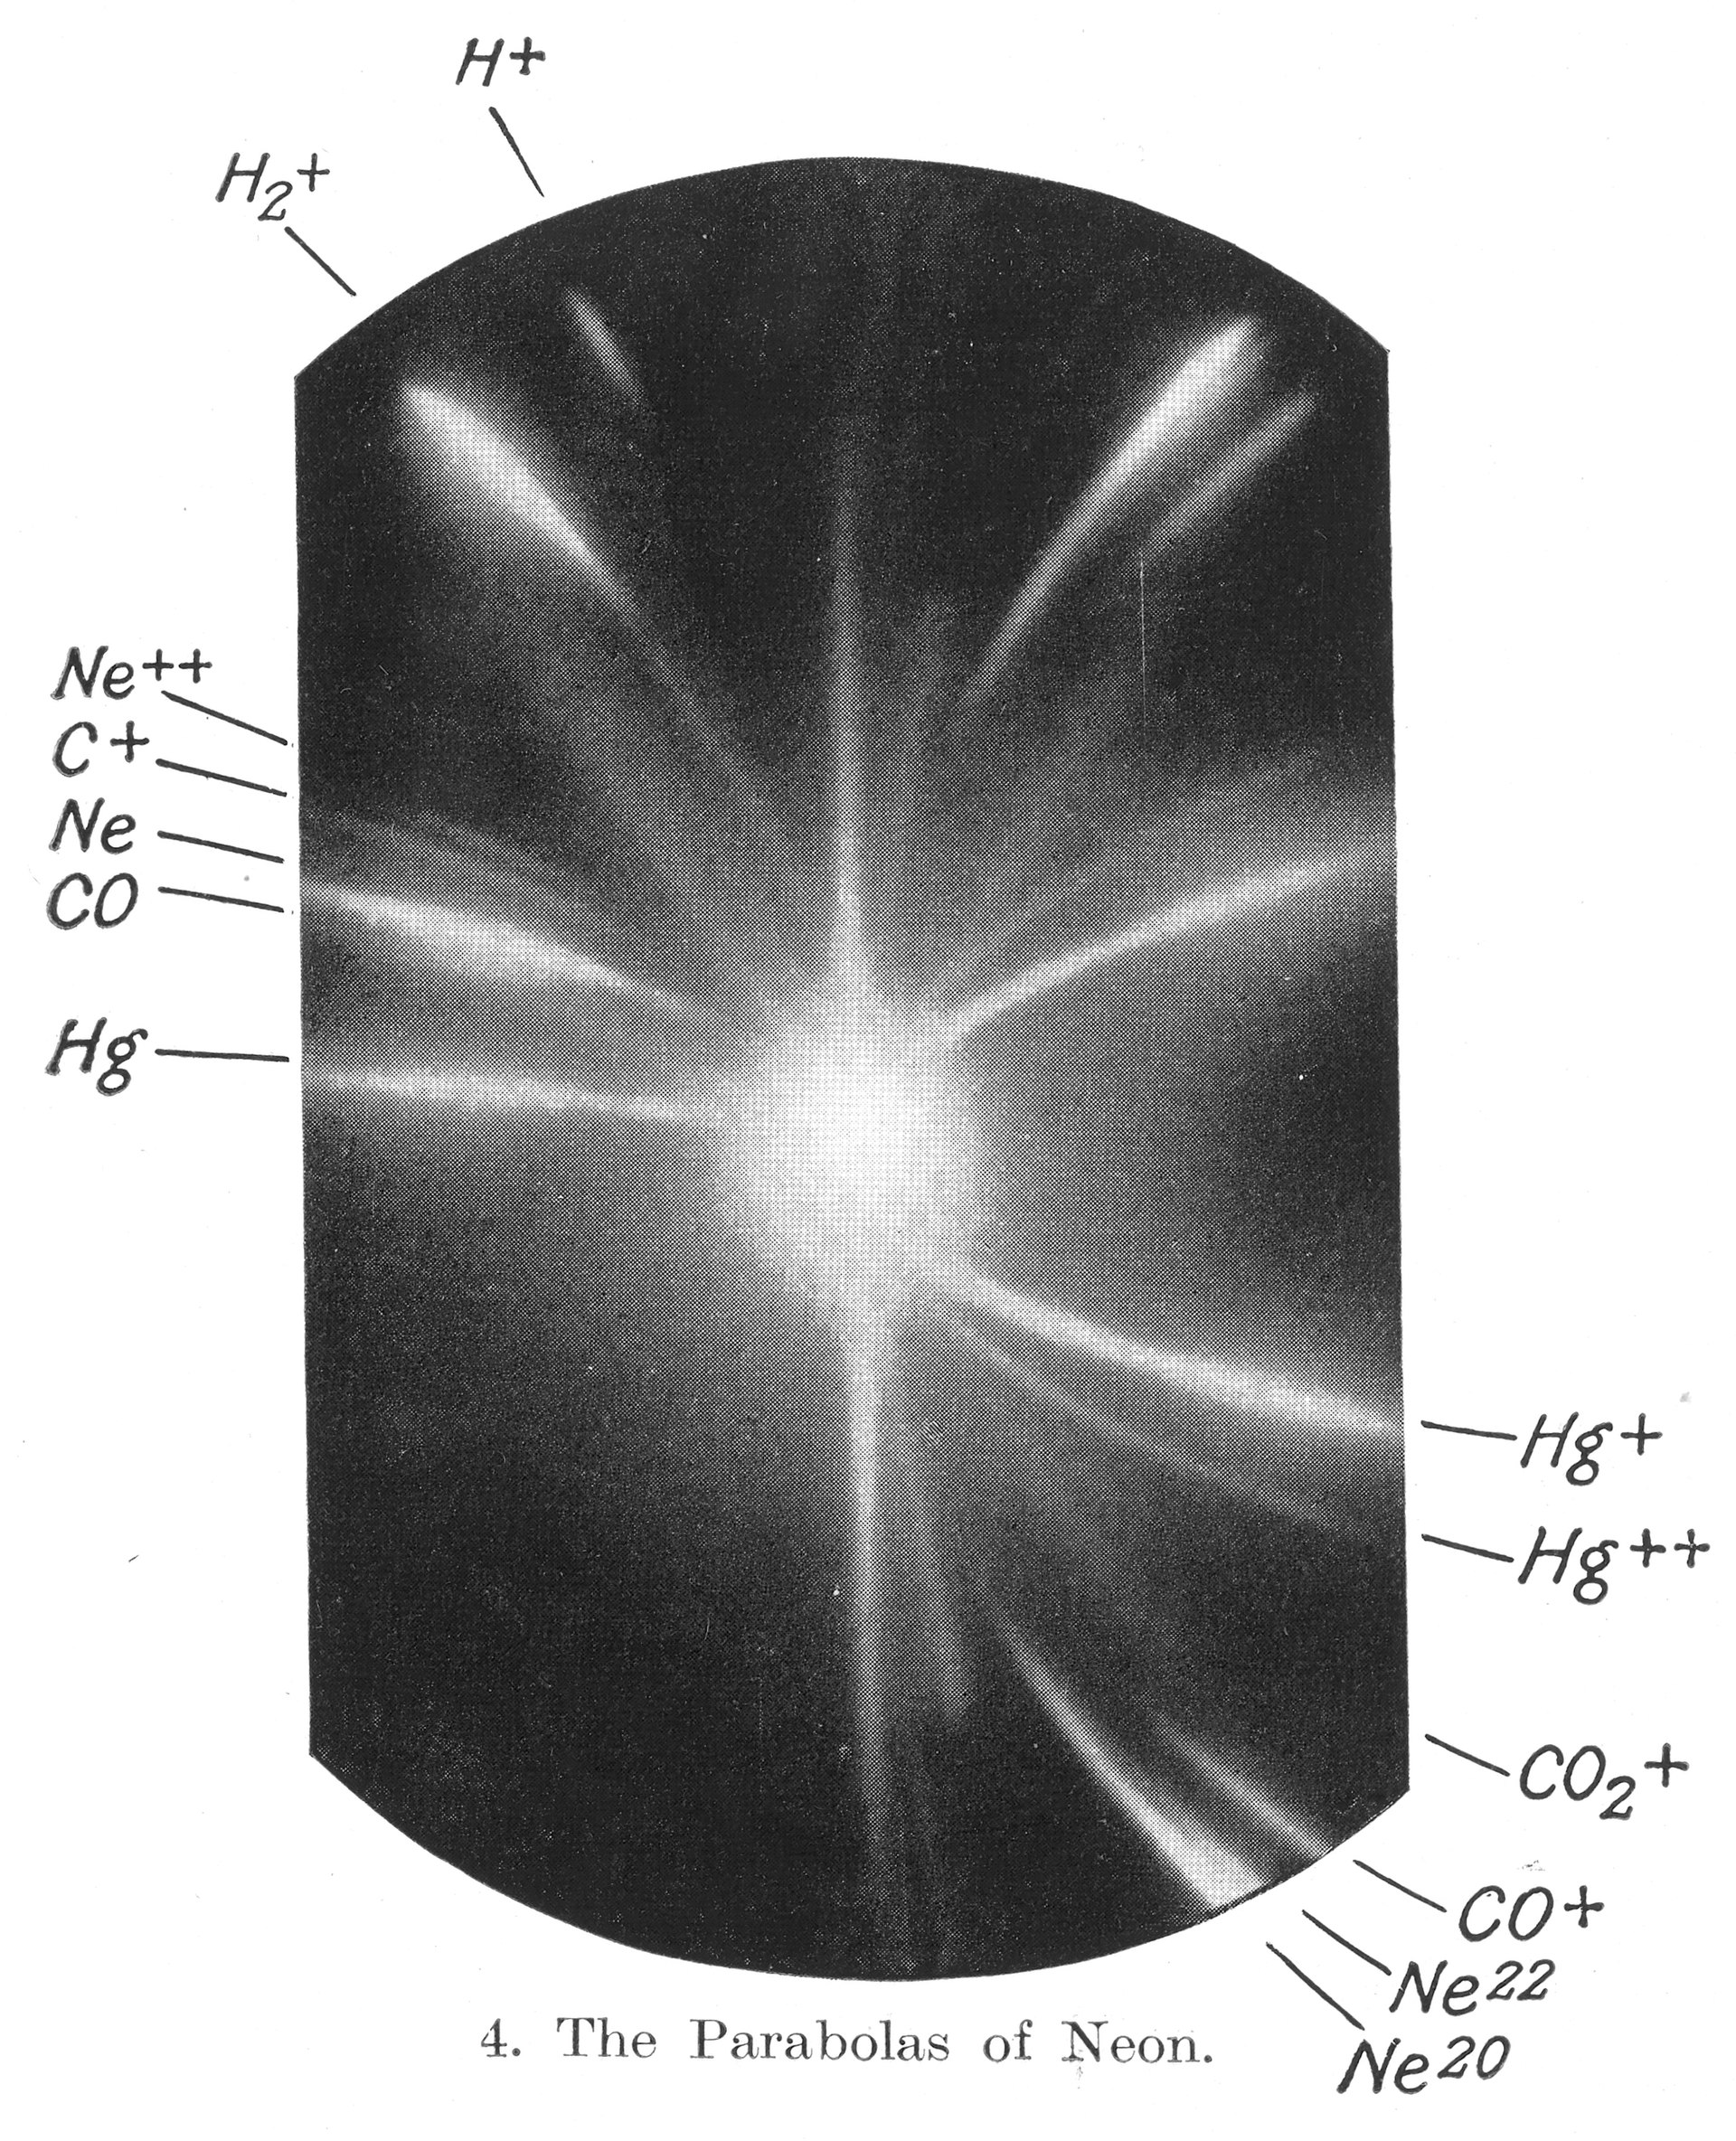
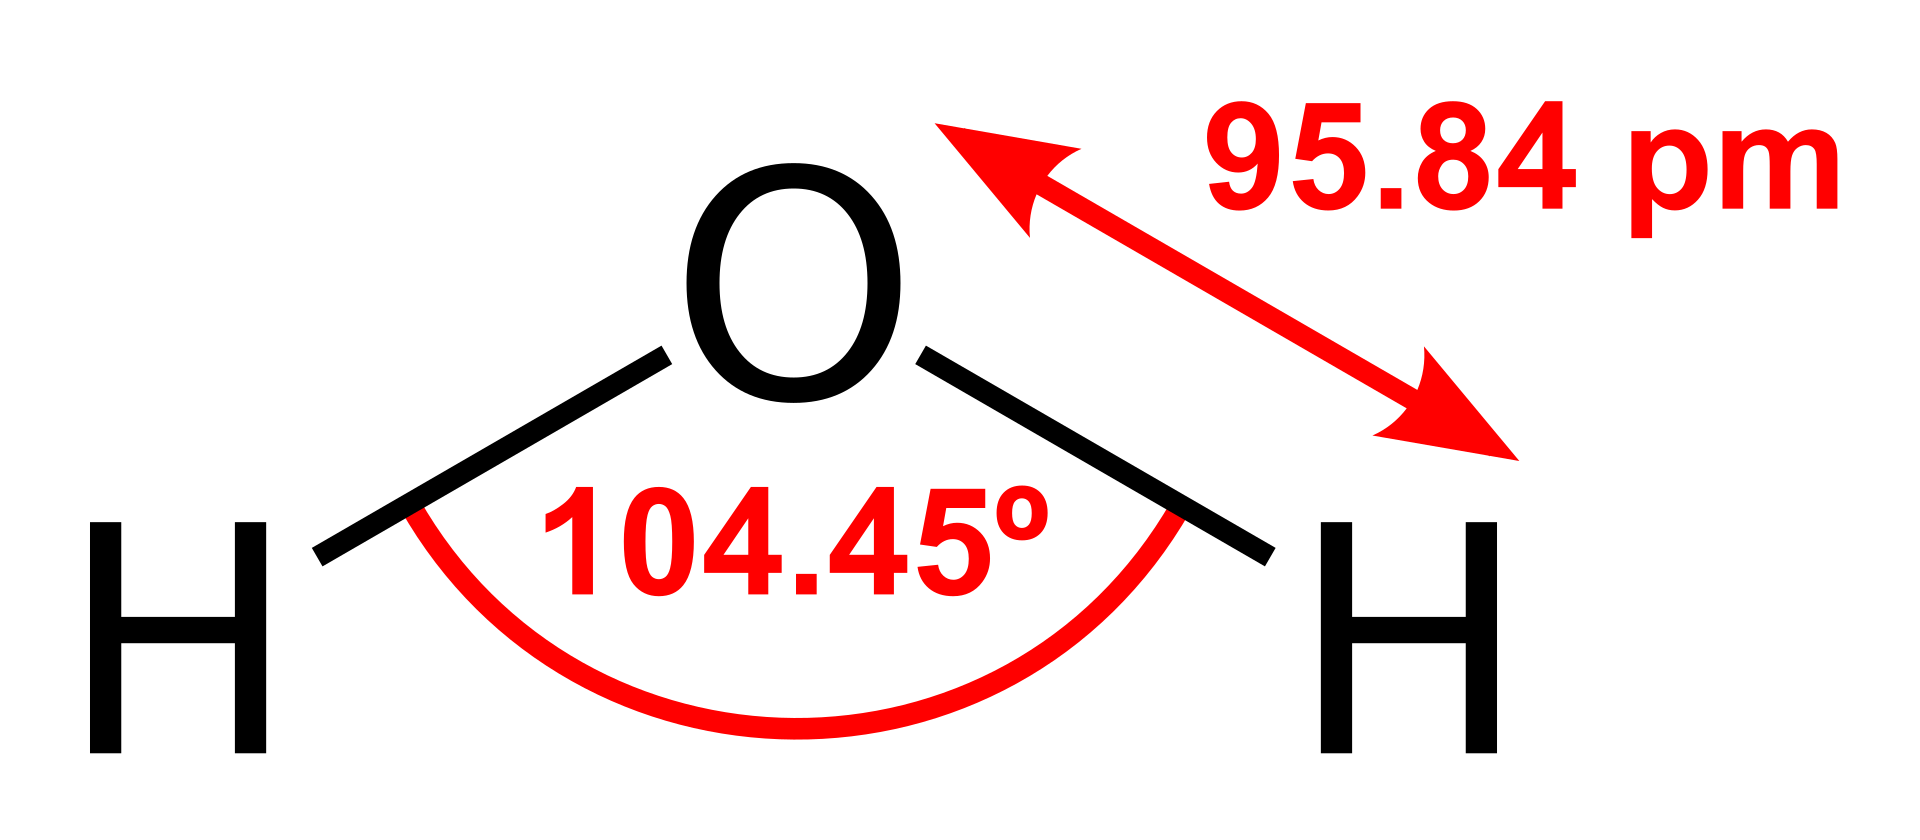
Underneath sit the constants everything inherits. The genetic code is a clean 64→20 lookup table — three bases choose one amino acid — and it's best drawn as a wheel. Photo 51 was the first time anyone saw the double helix, as an X-ray smudge. Mass spectrometry was born resolving the isotopes of neon. And the whole watery stage is set by one molecule's geometry: O–H at 95.84 pm, bent at 104.45°, which is why water is polar, why it dissolves life, and why that visible window exists at all.
Images of microbiology.
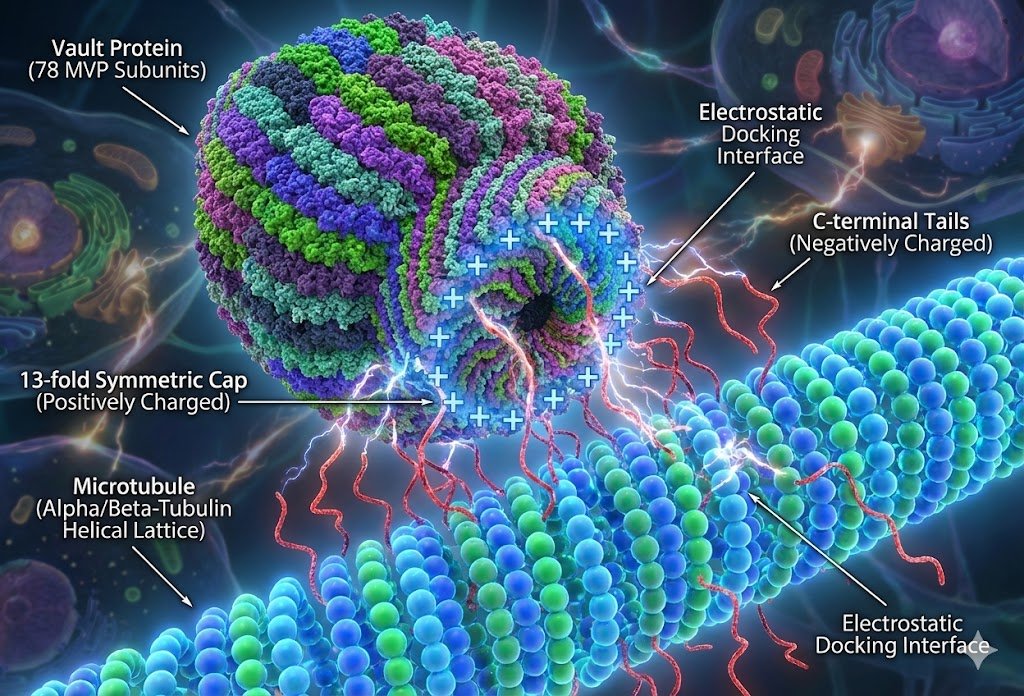
The machines themselves are gorgeous once you render them — here a vault protein docking onto a microtubule by raw electrostatics, positive cap meeting negative tails.
If biology is information, the real frontier isn't biology — it's the tooling. How we read the code, write it, and manufacture with it. This is the part I actually want to build in.
Methods for studying nature.
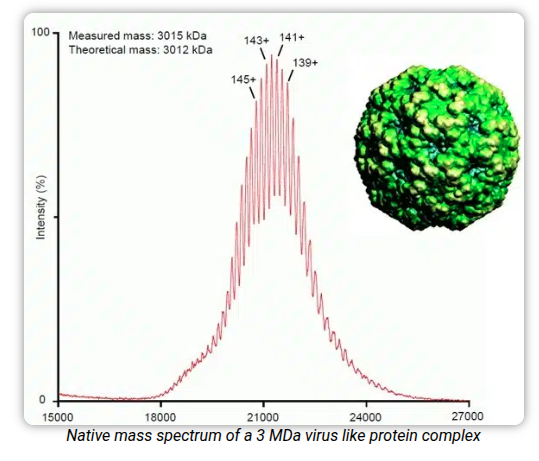
Reading DNA is inference, not photography. You shatter the molecule into fragments, read the pieces, and reassemble the original string from where they overlap — a giant out-of-order jigsaw. Weighing things is just as indirect: native mass spectrometry can put a number on a three-megadalton virus-like particle from how it flies.
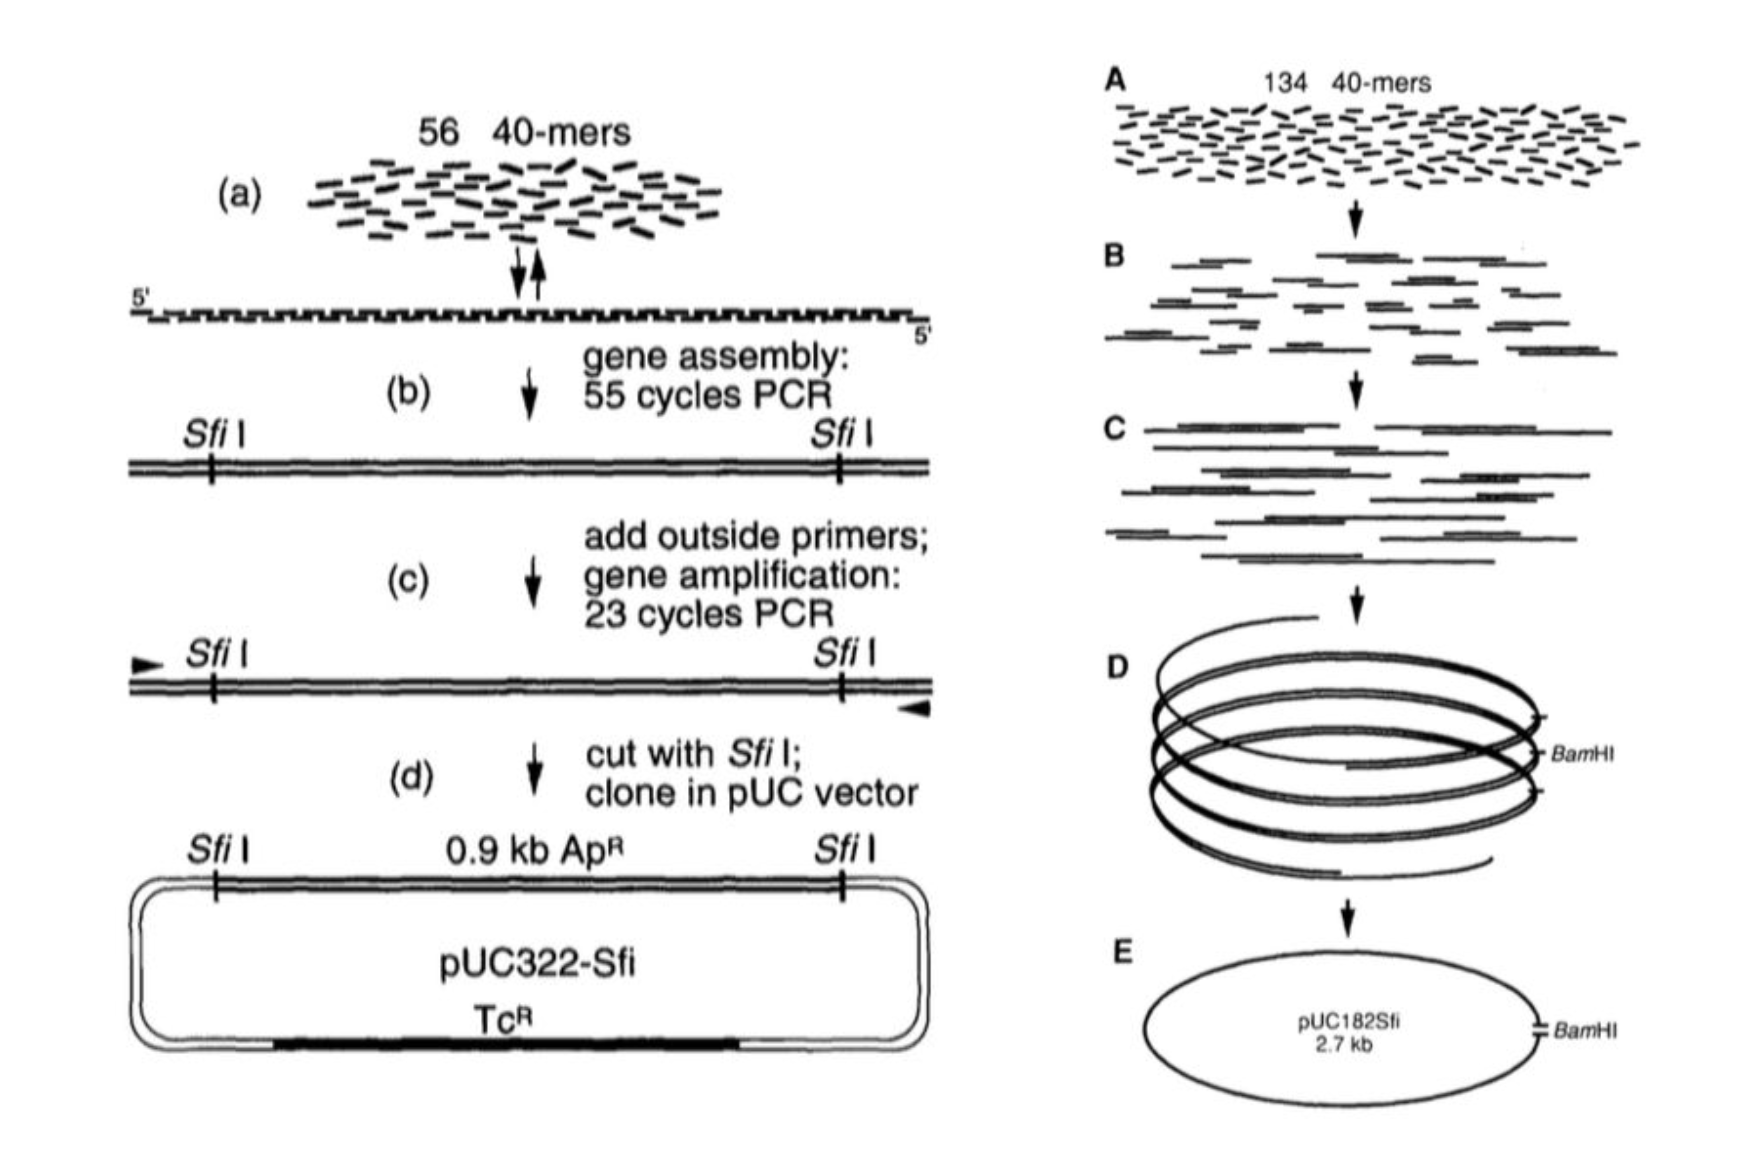
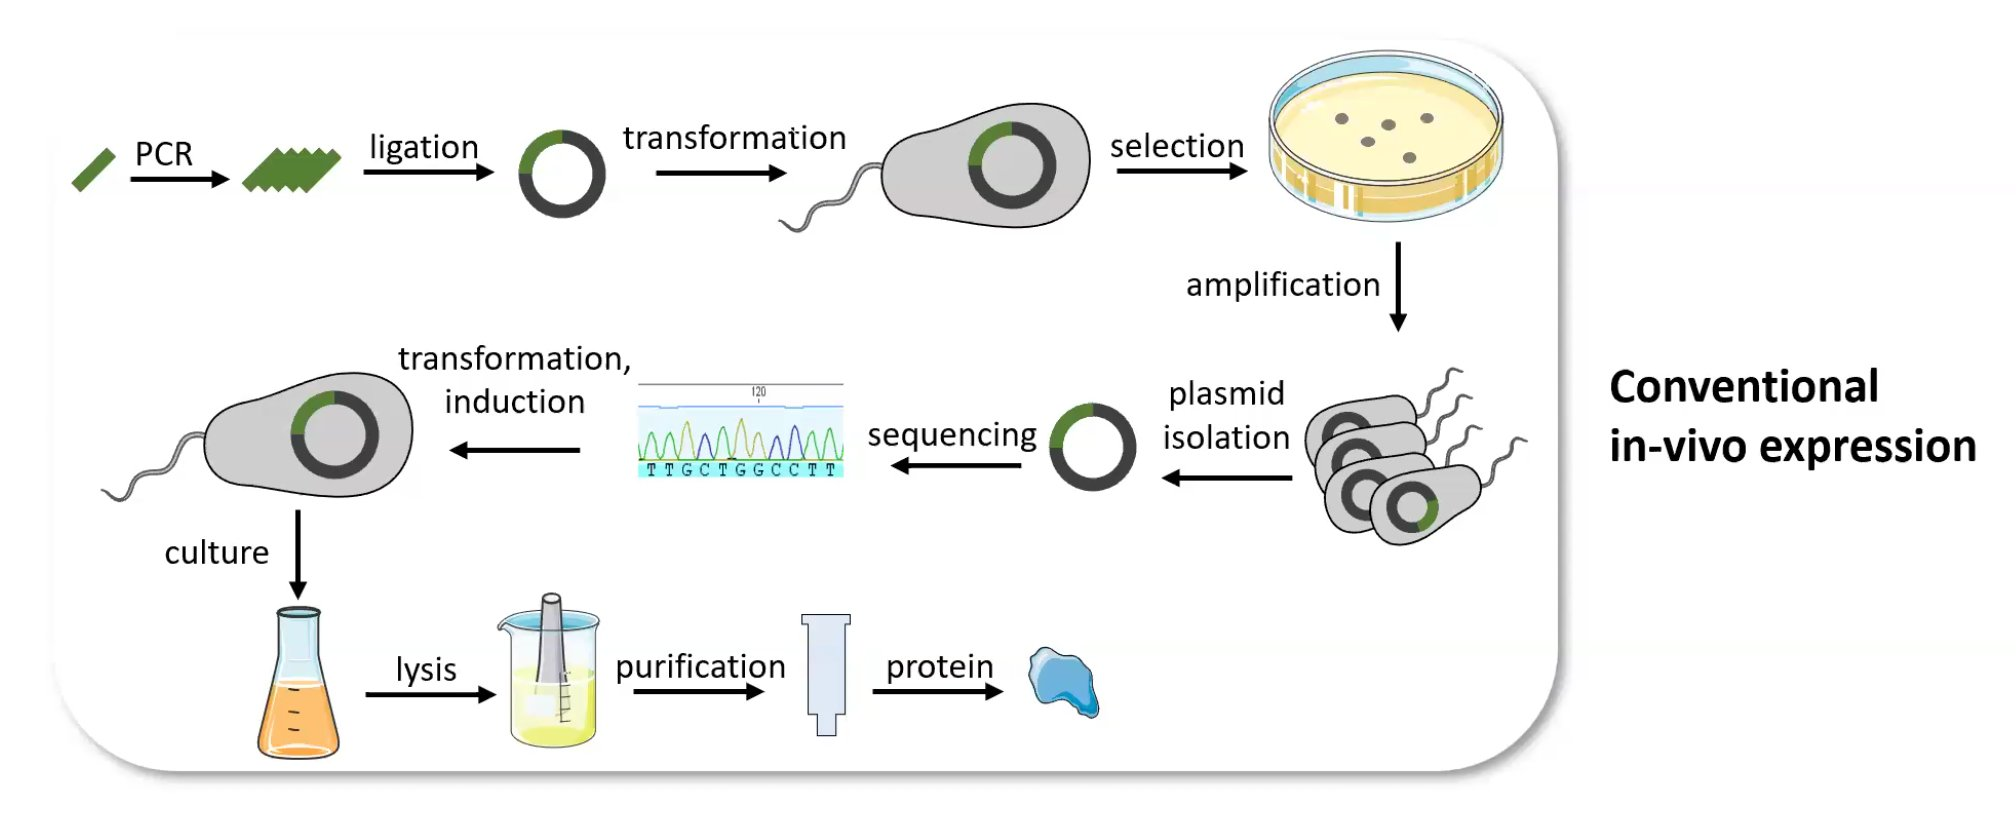
How we produce medicine (proteins).
Writing is the mirror image of reading. To make a protein like insulin you don't synthesise the protein — you synthesise its gene, clone it into a plasmid, drop it into a living cell, and let the cell's own machinery build and fold the thing. Recombinant expression: the organism is the factory.
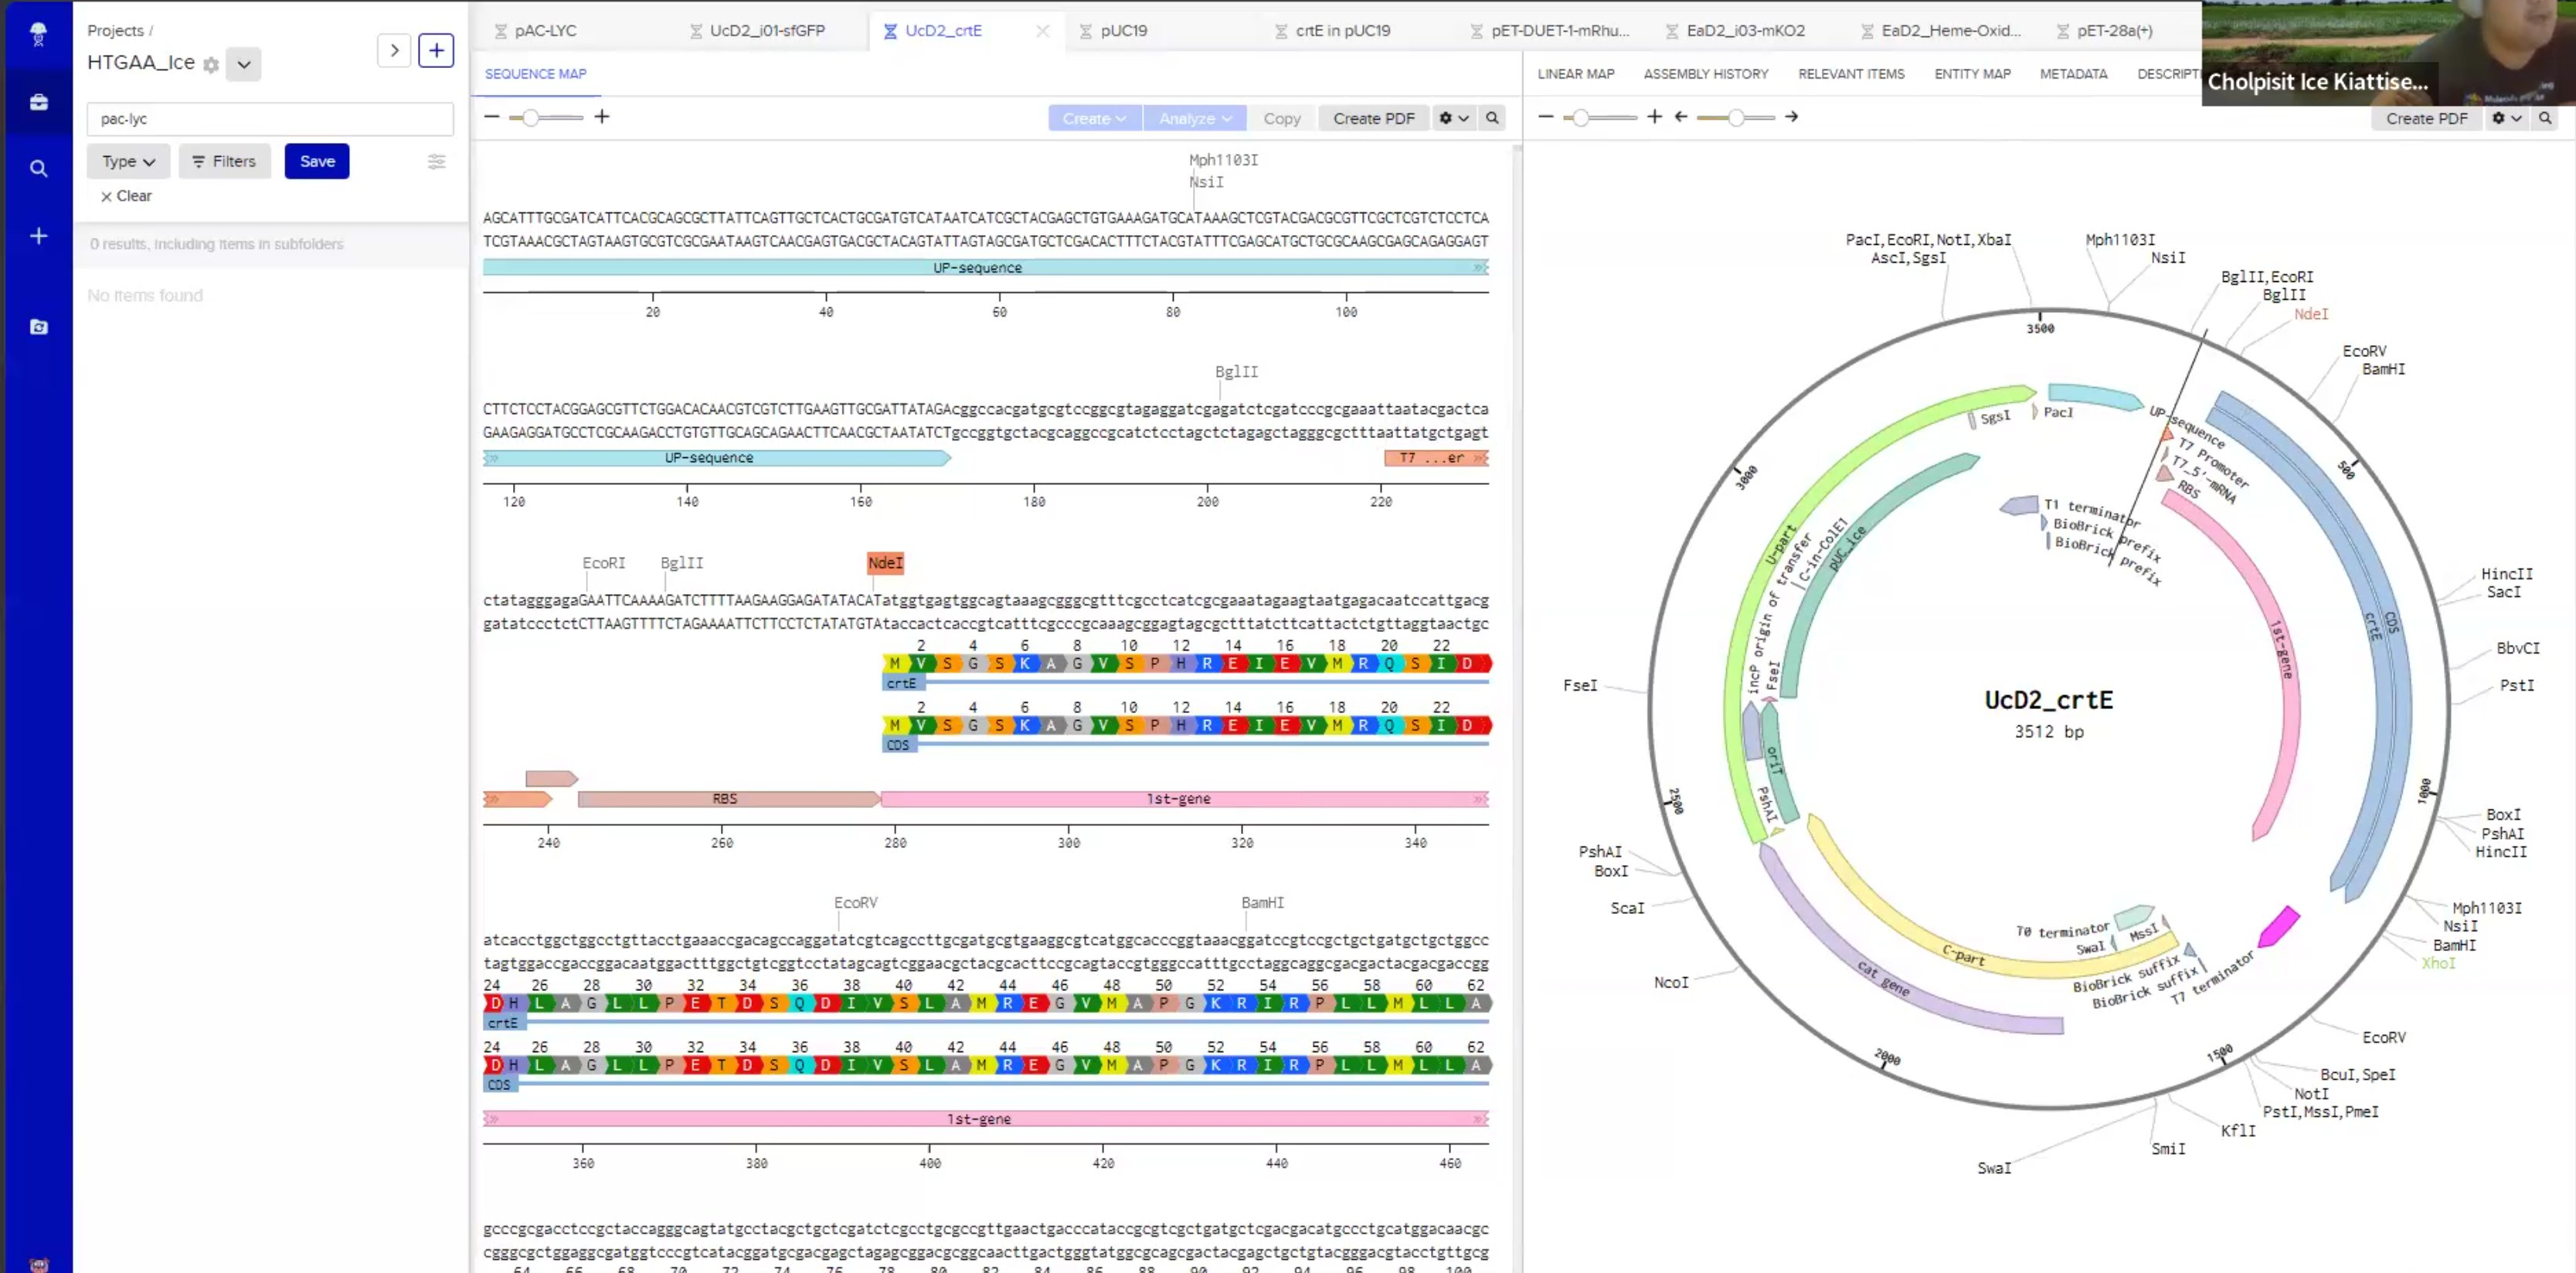
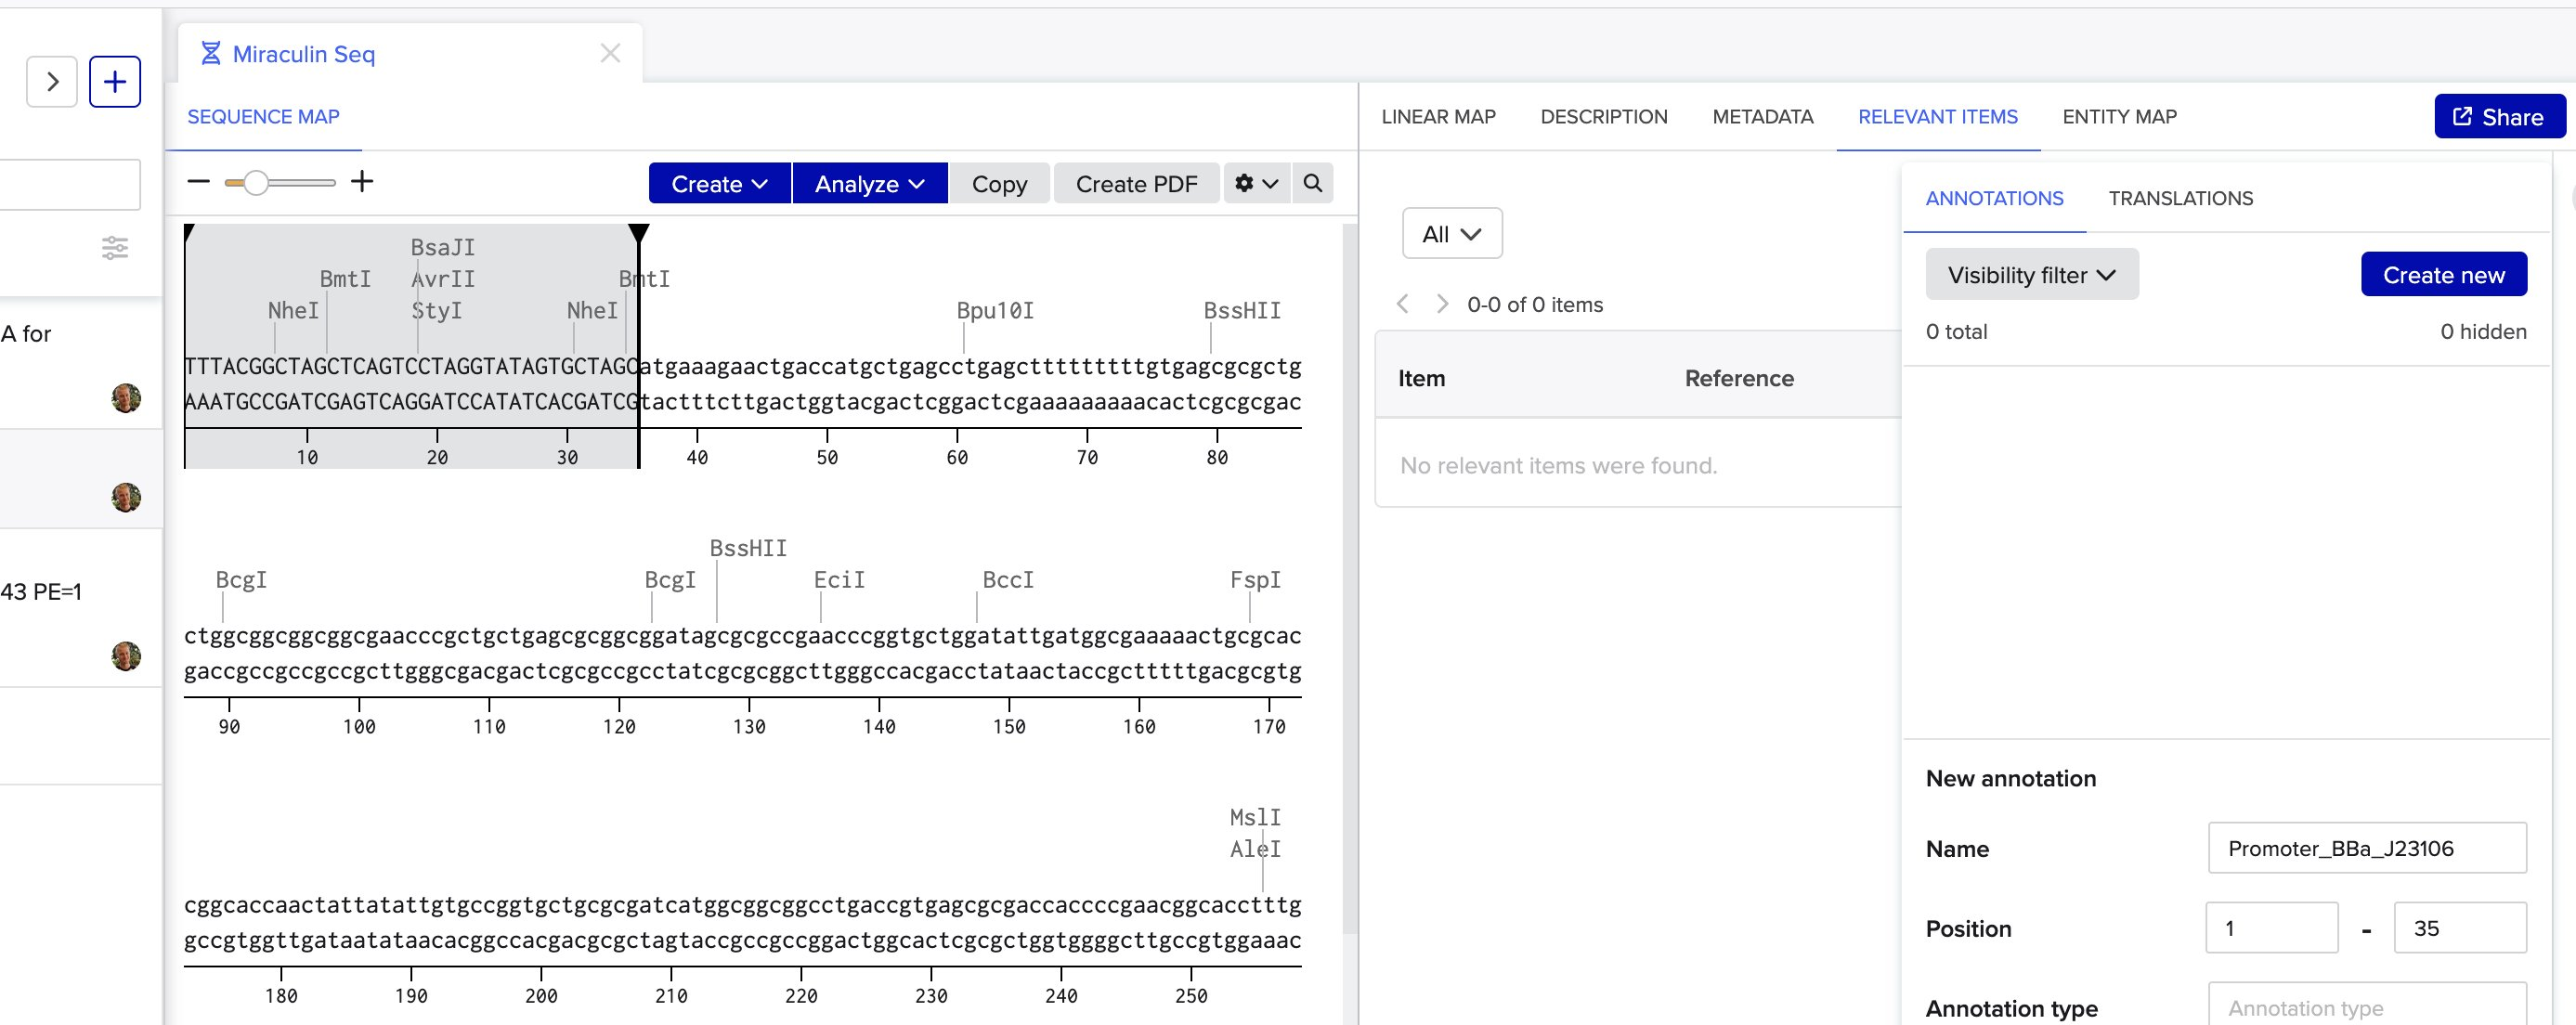
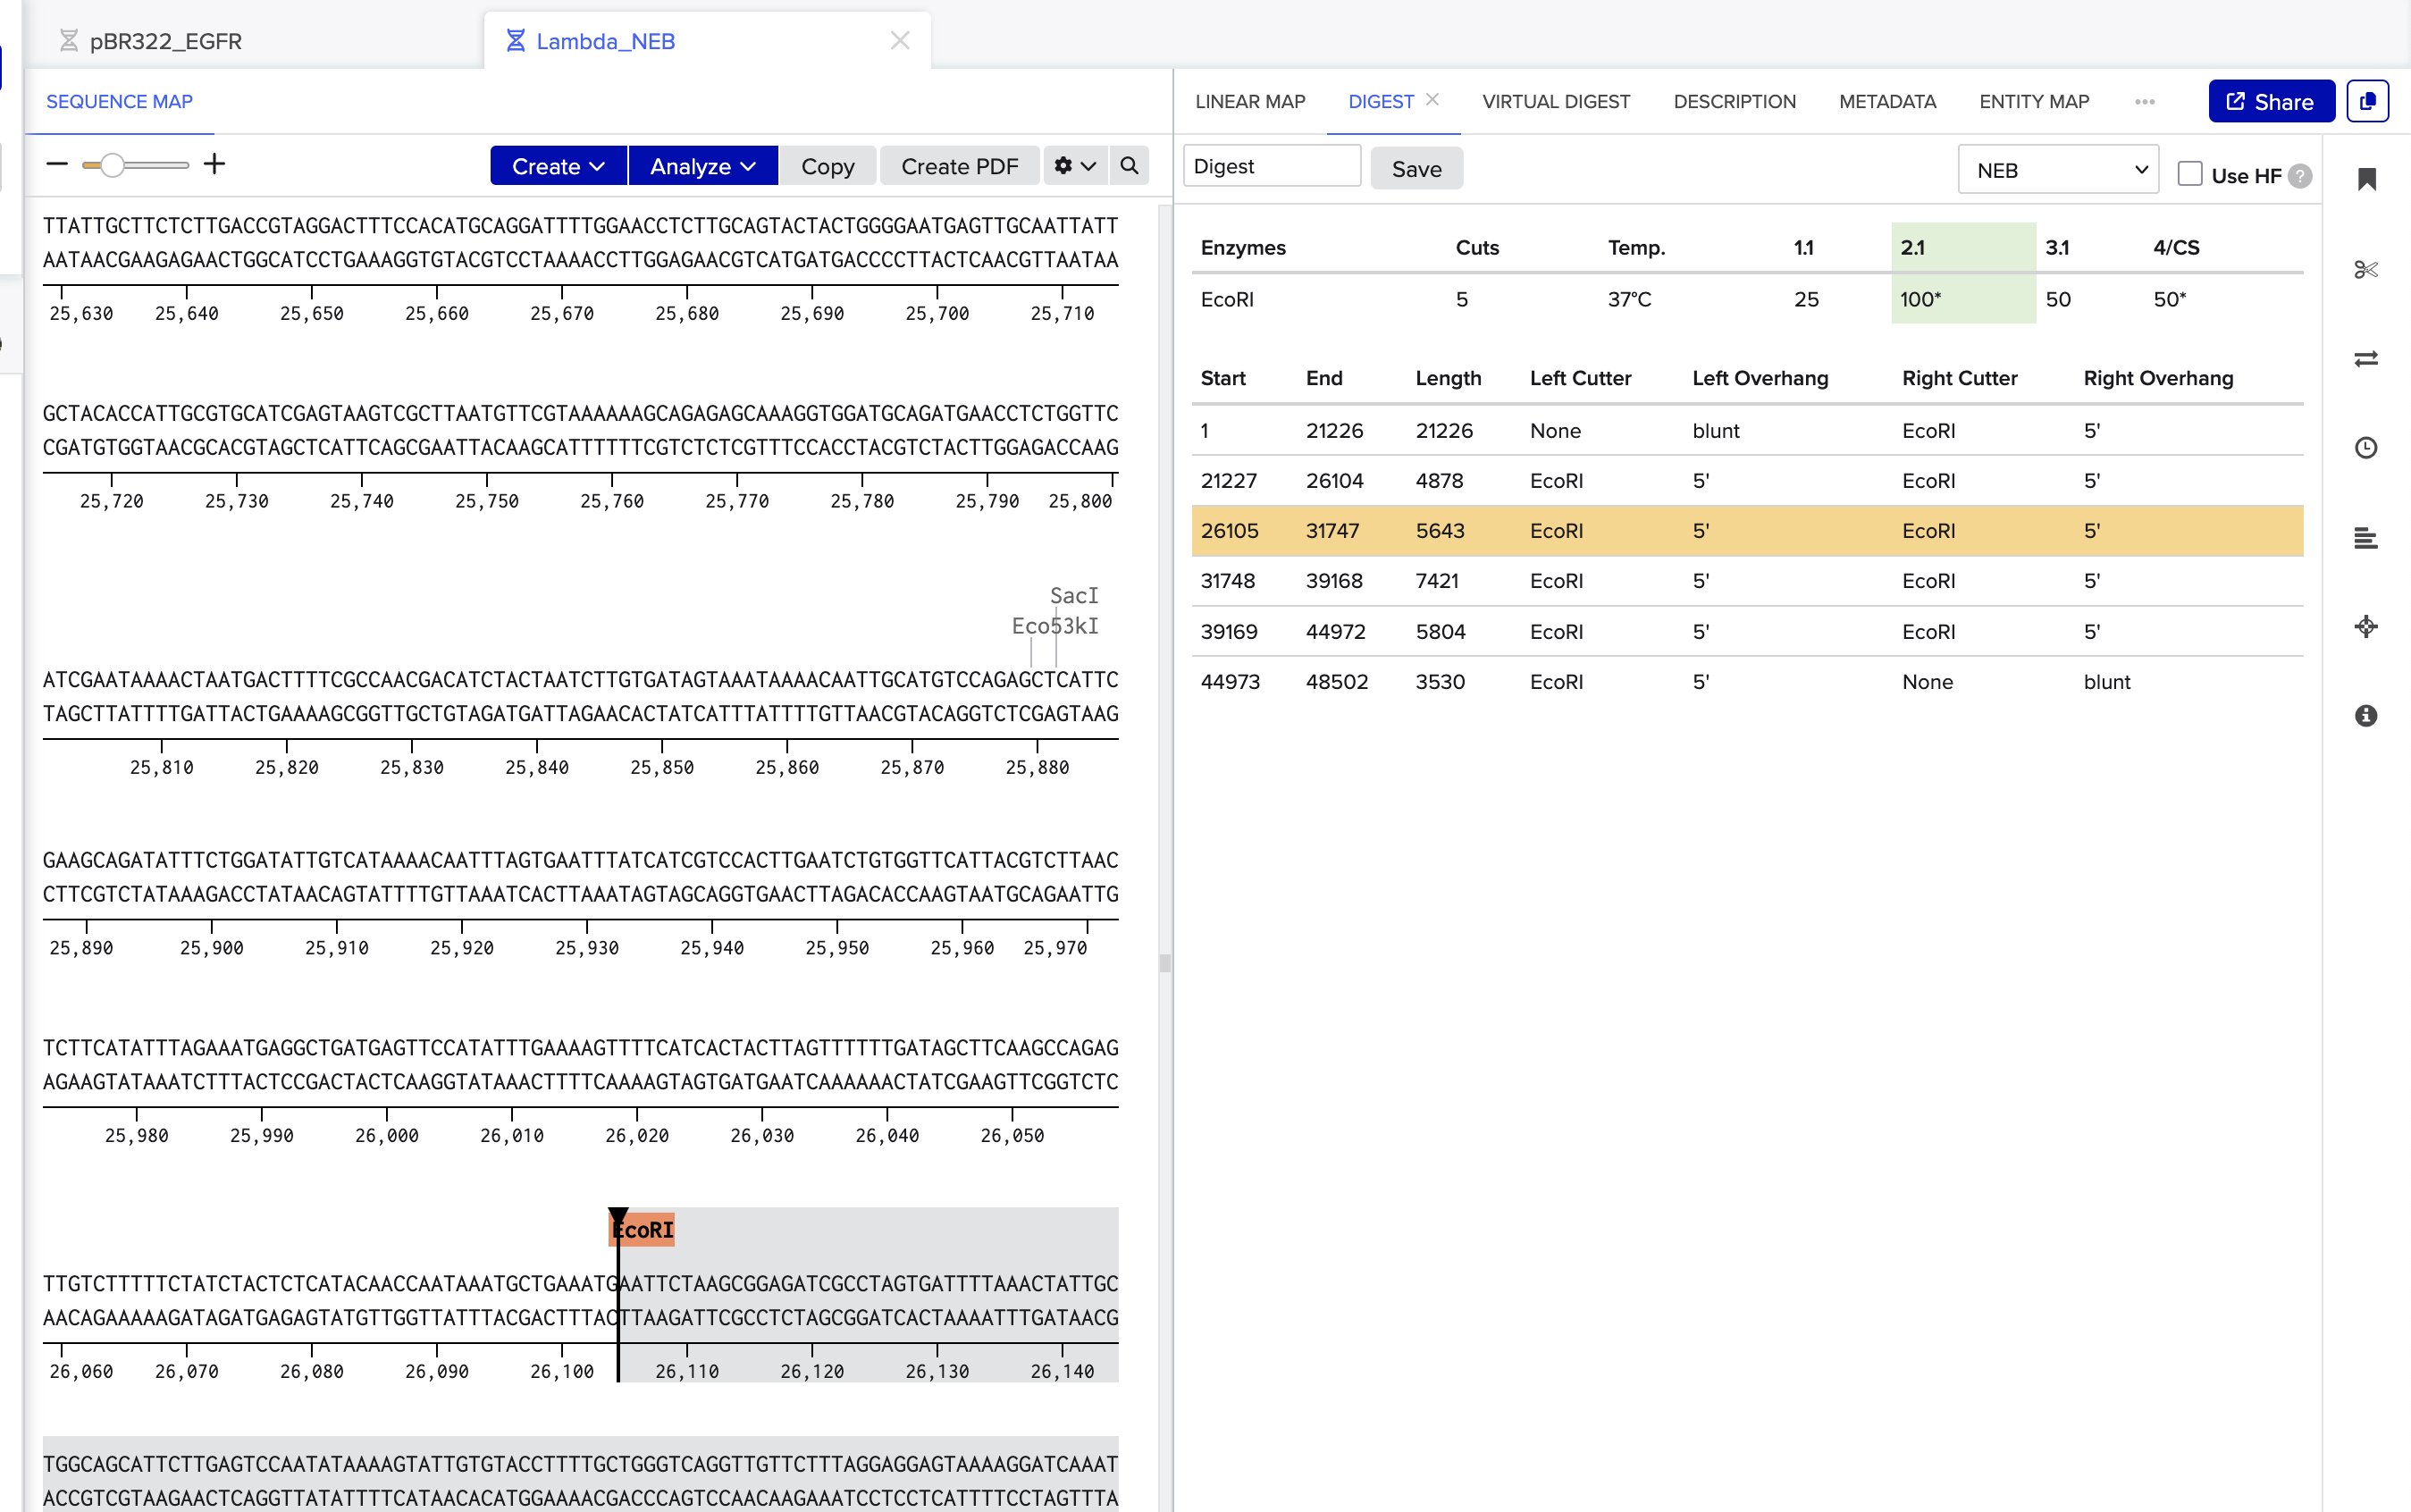
Software for biotech.
Which means biology needs an IDE. Benchling is the closest thing right now — sequence maps, plasmid design, restriction digests — the dev tools for DNA. Early days, and a section I'm still filling in.
None of these diagrams are mine — they're borrowed from papers, textbooks, patents and renders, credited where I could. What's mine is only the order: the path through them I wish someone had drawn for me.